Keywords
INTRODUCTION
Spectral analysis of the signals recorded during atrial or ventricular fibrillation provides information on the frequency domain.1-9 Studies have been performed on the relationship between the dominant frequency of these signals and the cycles determined by consecutive local activations,4,10-12 and these techniques have helped identify spatial and temporal heterogeneity in the activation frequencies during fibrillatory processes.5,6,13,14 In addition, their use with or without mapping techniques has allowed characterization of changes in the activation patterns induced by drugs,1-3,10,15 ischemia,4,16-18 and physical agents, including variations due to temperature11 and local stretching.8,12,19 In the clinical setting, spectral techniques have been widely used in relation to several aspects of ventricular fibrillation (VF), such as the development of useful algorithms for identifying arrhythmia20-22 or predicting the success of resuscitation maneuvers following cardiac arrest caused by VF.23-26 Recently, these techniques have been applied to identify regions of interest that could be candidates for therapeutic interventions in fibrillatory processes.13,14
Analysis in the frequency domain has raised several methodological questions related to the inherent characteristics of the procedure.9,27,28 With regard to signals obtained directly from the heart, one aspect that has not been extensively investigated is the impact of the recording mode (ie, bipolar or unipolar) on the information obtained.29 The characteristics of electrograms differ depending on whether bipolar or unipolar electrodes are used. When bipolar electrodes are applied, the orientation of the activation fronts and, therefore, the temporal phase difference between the signals obtained with the 2 electrodes determines the morphology of the electrogram. With the use of unipolar electrodes, the recording often contains potentials that are not generated by local activation, but instead, originate at a distance from the region where the electrode is placed. The present study investigates the hypothesis that the type of electrode (ie, unipolar or bipolar) used for recording electrograms has an impact on the information obtained by spectral analysis techniques during VF. To examine this hypothesis, a multiple electrode system was used in the epicardium of an experimental model of isolated rabbit hearts. The parameters obtained in the frequency domain during VF were analyzed for unipolar electrodes and for bipolar electrodes with a varying separation distance between them.
METHODS
Experiment Preparation
The procedures used in this study are in keeping with current guidelines for the care and use of laboratory animals for research purposes. The study was performed with isolated, perfused hearts of New Zealand rabbits (n=29; weight, 2.6 [0.2] kg). Following anesthesia (25 mg/kg intramuscular ketamine) and heparinization, the heart was removed and immersed in cold Tyrode solution (4oC). The aorta was isolated and connected to a Langendorff system to enable Tyrode perfusion at 60 mm Hg pressure and 37 (0.5)oC temperature (millimolar composition: NaCl, 130; NaHCO3, 24.2; KCl, 4.7; CaCl2, 2.2; NaH2PO4, 1.2; MgCl2, 0.6; glucose, 12). Recordings were made with a multiple electrode system containing 121 electrodes (diameter, 0.125 mm; distance between electrodes, 1 mm), arranged in quadrature format (1111) and located in the epicardium of the left ventricular (LV) free wall. The indifferent electrode consisted of an Ag/AgCl plaque placed over the aorta. Ventricular stimulation was performed with a bipolar electrode, and a GRASS S88 stimulator coupled with a stimulus isolation unit (SIU5). The recordings were obtained with a system for mapping the electric activity of the heart (MAPTECH). Electrograms were recorded in the 1 to 400-Hz frequency band (sampling frequency, 1 kHz). Ventricular fibrillation was induced by stimulation at increasing frequencies and perfusion was maintained during arrhythmia.
Data Analyzed
Spectral Analysis of Electrograms During Ventricular Fibrillation
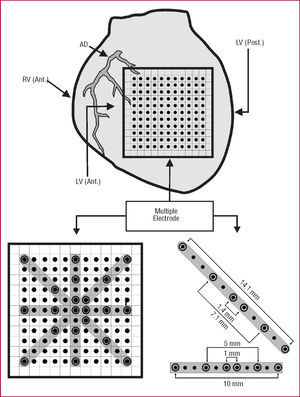
For both the unipolar and bipolar modes, the method of Welch30 was used to obtain the energy spectrum of the signals obtained with electrodes selected from the multiple electrode matrix (Figure 1). For bipolar configurations (separated by a distance of 1, 5, or 19 mm), the energy spectrum was taken in both the horizontal and vertical orientation. In addition, recordings obtained in the 2 diagonals were analyzed (A, superior right-inferior left; B, superior left-inferior right), and in this case interelectrode distances were 1, 4, 7.1, and 14.1 mm.

Figure 1. Diagram illustrating preparation of the experiment and the electrodes used to perform the bipolar recordings. The separations are indicated in the lower right-hand area. ANT indicates anterior; AD, anterior descending artery; LV, left ventricle; POST, posterior; RV, right ventricle.
The analysis was performed using 4096-point blocks without zero padding.9 Data were processed with Matlab on a Hewlett-Packard 712/80 platform. The following parameters were determined:
DF: dominant frequency or frequency (expressed in Hz) of the energy spectrum with the greatest amplitude
MF: mean frequency of the spectrum (in Hz)
NSE: normalized spectral energy around the dominant frequency band (DF [1] Hz) (normalized units with respect to total energy)
Determinations were performed using the recordings obtained with unipolar and bipolar electrodes for the different interelectrode distances and orientations studied. For the comparison between unipolar and bipolar recordings, the cross-spectrum was obtained to determine spectral coherence (ie, the similarity between the spectra of the 2 recordings analyzed) for each frequency (1=complete similarity and 0=complete lack of similarity).
Statistical Analysis
Data are expressed as the mean (1 standard deviation [SD]). The data obtained with the unipolar and bipolar electrodes were compared using a general linear model for repeated measures (SPSS), considering the recording mode as a within-subject factor. Differences were considered significant at P<.05. Linear regressions were performed using the least-squares technique.
RESULTS
Dominant Frequency
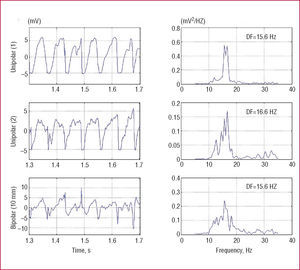
The signals recorded in 1 patient using 2 unipolar electrodes 10 mm apart in the horizontal axis, as well as the respective bipolar recording, are shown in Figure 2. The main component of the unipolar recordings presents some phase difference between the 2 electrodes and the bipolar recording shows the same component somewhat attenuated; nonetheless, in the frequency spectrum, the bipolar DF is similar to that obtained with the unipolar mode. Figure 2 shows the tracings from another experiment obtained with 2 electrodes placed 1 mm apart in the horizontal axis. In the unipolar recordings, the greatest signal fluctuations are approximately in phase. For this reason they are cancelled out in the bipolar recording and give rise to the development of fast waves with a differing DF from that of the unipolar mode.

Figure 2. Frequency spectra (right) of the ventricular fibrillation signals (left) recorded in 1 of the experiments with the unipolar electrodes and bipolar electrode (separation, 10 mm; horizontal direction). The dominant frequency (DF) in the 3 recordings is similar.

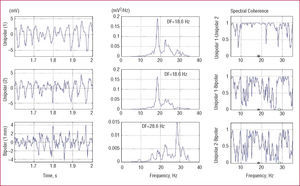
Figure 3. Frequency spectra (center) of ventricular fibrillation signals (left) recorded in 1 experiment with the unipolar electrodes and bipolar electrode (1-mm separation, horizontal orientation). The dominant frequency (DF) is indicated and is greater in the bipolar recording in this case. The coherence function is shown on the right, with high values in the unipolar relationships (Unip.1-Unip.2) and lower values when each unipolar recording is related to the bipolar recording.
Analysis of the relationship between DFs obtained with the 2 recording modes (bipolar and unipolar) revealed that the regression coefficients for each of the interelectrode distances in the various orientations were significant in all cases (Table 1 and Figure 4) and ranged from 0.96 to 0.46. Although the coefficients were significant, certain discrepant values that decrease the magnitude of the coefficients and may be related to smaller degrees of spectral coherence between the 2 recording modes are evident in the graphs.


Figure 4. Regression lines obtained when dominant frequency (left) or mean frequency (right) of the bipolar recording is related to that of one of the unipolar electrodes (vertical orientation and diagonals A and B). DFBIP indicates dominant frequency, bipolar mode; DFUNI, dominant frequency, unipolar mode; MFBIP, mean frequency, bipolar mode; MFUNI, mean frequency, unipolar mode; r, regression coefficient; SE, standard error of the estimate.
When differences between the mean DF values obtained with the 2 recording modes were examined (Table 2), a significant difference was only obtained for 1 of the diagonals when the bipolar mode at 7.1-mm separation was compared with 1 of the unipolar recordings. In the remaining orientations, DF values were similar for both recording modes at the various interelectrode distances. A general analysis of all data was performed to determine the impact of the distance factor and orientation factor; no significant differences were found.

Mean Frequency
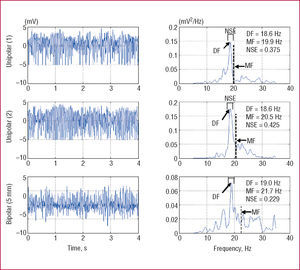
The spectra obtained in 1 of the unipolar and bipolar (5-mm separation) recording experiments are shown in Figure 5. Although DF values are very similar in the 2 modes, MF differs between them. MF is greater in the spectrogram obtained with bipolar mode because there are more frequency components in the high-frequency area of the spectrum.

Figure 5. Frequency spectra of unipolar and bipolar recordings (5-mm separation. vertical orientation) from 1 experiment in which the bipolar mode shows greater dispersion of the spectrum, resulting in higher mean frequency values (MF) and lower normalized energy values (NSE) in the DF (1) Hz frequency band. The dominant frequency (DF) is very similar in the 3 recordings.
The linear regression results obtained in the analysis of MF values recorded in bipolar and unipolar modes are shown in Table 3. The regression coefficients for each interelectrode distance in each orientation were also significant in all cases (Table 3 and Figure 4), with values ranging from 0.96 to 0.80.

Mean values (SD) are indicated in Table 4. In this case, significant differences are observed between the values obtained with unipolar or bipolar recording in the horizontal axis (10-mm separation), in the vertical axis (1-mm, 5-mm, and 10-mm separations), in diagonal A (7.1-mm separation), and in diagonal B (1.4-mm and 7.1-mm separations). Combined analysis of the variables interelectrode distance and recording mode (bipolar or unipolar) also showed differences in horizontal orientation (P<.01) as well as both diagonals (A, P<.05; B, P<.001). Overall analysis to determine the impact of the interelectrode distance and recording mode factors showed a significant influence of the former, but not the latter.

Normalized Spectral Energy Around the Dominant Frequency Band (1 Hz)
The frequency components concentrated around the DF are shown in Figure 5. In bipolar mode, the percentage of energy in the DF band with respect to the total energy of the spectrum is lower. This decrease in NSE is the result of greater dispersion of the components of the spectrum, which includes more high-frequency components and, therefore, leaves fewer components around the DF.
Normalized spectral energy values in the various recording conditions are shown in Table 5. These values were lower in bipolar recordings in the horizontal (1-mm and 5-mm separation) and vertical axes (1-mm, 5-mm, and 10-mm separations), and in diagonal A (1.4-mm separation), and diagonal B (1.4-mm, 7.1-mm, and 1-mm separations). Combined analysis of interelectrode distance and recording mode showed significant differences in the vertical orientation (P<.05) and in one of the diagonals (B, P<.0001). In the overall analysis of all data, interelectrode distance showed a significant impact, whereas orientation had no effect.

Spectral Coherence
After obtaining the cross spectrum between the 2 recordings, the coherence analysis among the unipolar recordings and between each unipolar recording and the respective bipolar recording (Figure 3) yielded the results shown in Table 6. Mean coherence values among the unipolar recordings significantly decreased as the interelectrode separation increased, whereas the opposite occurred in unipolar versus bipolar recording: higher coherence values were obtained in recordings with greater interelectrode distance. Spectral coherence among unipolar recordings, and between unipolar relative to the respective bipolar recording showed significant negative correlations. The regressions lines obtained considering the spectral coherence of each unipolar recording (U1 or U2) with respect to the corresponding bipolar value (Bip) as the dependent variable, and the coherence among unipolar recordings as the independent value were as follows:

Coherence (U1-Bip)=0.516Coherence (U1-U2)+0.936; (r=0.29; standard error of the estimate [SE]=0.102; n=348; P=.0001).
Coherence (U2-Bip)=0.470Coherence (U1-U2) +0.886; (r=0.27; SE=0.104; n=348; P=.0001). That is, spectral coherence between each of the unipolar and respective bipolar recordings was inversely related to spectral coherence among the unipolar recordings.
DISCUSSION
The principal finding of the present study is that the use of bipolar or unipolar recording modes results in differences in the information obtained with spectral techniques during VF. The differences were mainly seen in the MF and the spectral frequency distribution; there was little impact on the DF.
Analysis of Ventricular Fibrillation Signals
Several parameters are used to analyze atrial and ventricular fibrillatory processes in the time domain, such as those related to duration of the electrograms and the cycles they determine and those related to morphological aspects of the signals. The use of these parameters allows characterization of several aspects of these arrhythmias, among them the local activation cycles, spatial patterns of myocardial activation, and the relationship between these factors and the morphology of the recordings.31-33 Various activities are based on, or facilitated by, this type of analysis: identification of the block lines, determination of the complexity of the activation patterns and modifications induced by therapeutic actions, interpretation of activation maps, and identification or exclusion of regions of interest for applying ablation procedures.
In the frequency domain, spectral analysis of VF provides various useful parameters. One of them is the DF, which is directly related to the inverse of the mean activation cycles during arrhythmia,4,10-12 since electrograms originated by local myocardial activation correspond to the principal fluctuation of the signals recorded. The mean frequency divides the spectrum into 2 zones of equal energy and depends on the frequency distribution. For this reason, the MF is more sensitive to the presence of the various components, which, together with the dominant frequency, form the signal spectrum. The recording modes (ie, unipolar or bipolar) determine the characteristics of the signals obtained during fibrillatory processes, and these can introduce modifications in the spectral components. When unipolar recording is used, spectral parameters provide information on the activation in each electrode, although components originating from signals in distant zones may be incorporated. In the case of bipolar recordings, the spectral parameters indicate differences between the 2 electrodes, and if they are in-phase, they cancel each other out. Hence, the components of the spectrum can vary according to the characteristics of the activation fronts that are successively reached by one or the other electrode.
In the present study, significant differences were observed in the parameters most closely related with the frequency distribution, that is, the MF and NSE, whereas differences in the DF were much smaller. This fact is likely related to the changing characteristics of myocardial activation during VF, which lead to variable phase differences between electrode activations in recordings done in the bipolar configuration. These phase differences depend on the separation between the electrodes and the direction of the activation fronts. If the direction were constant, phase differences would have a considerable influence on spectral coherence; nevertheless, the activation direction varies in VF and the changes that occur during the lapses recorded are likely to diminish the importance of coherence. Another factor that might be implicated is the possibility that the origin of the activation fronts reaching each electrode in the bipolar mode might differ, a fact that would determine both the direction and frequency of myocardial activation. These differences are less probable when the distance separating the electrodes is smaller and this might explain the greater coherence between unipolar recordings when the separations are minimal. Because the lowest coherence values for unipolar versus bipolar signals were obtained with these separations, any possible differences in the frequency of myocardial activation become less important. The present study shows that the distance between the electrodes determines the degree of coherence among unipolar recordings and between a unipolar and the corresponding bipolar recording, such that the closer the unipolar electrodes are, the greater the coherence between them; this effect is less pronounced with respect to the bipolar recordings, however. In addition, coherence between each of the unipolar and respective bipolar recordings was inversely related to coherence among the unipolar recordings alone.
Comparisons between the DP values obtained in the various recording conditions did not show substantial differences, whereas comparisons between the MF values did show significant variations. Mean frequency and the NSE are influenced by the set of spectral components, and variations in these parameters would be consistent with the differences found in spectral coherence. Spectral coherence differed according to the comparisons studied (among the unipolar recordings or unipolar with respect to bipolar) and according to the separation between electrodes.
From the practical viewpoint, DF is the spectral parameter that has been most widely used to characterize myocardial activation during fibrillatory processes in both clinical practice and experimental studies, and this study highlights that there are no significant differences in this parameter according to the recording mode used.
Clinical Implications
The use of spectral methods to analyze atrial and ventricular fibrillation is not limited to experimental studies. Their application in the clinical setting is mainly related to identifying fibrillation20-22 and regions of interest for applying therapeutic interventions,13,14 to analyze external signals, to assess patient status following cardiac arrest due to VF, and to predict the success of maneuvers aimed toward defibrillation.23-26 For the identification algorithms based on intracavitary recordings and for characterization of regions of interest during electrophysiological studies, the analysis implies comparing parameters obtained at different time points or in different regions of the myocardium. To this purpose, the recording and analysis criteria should be uniform and factors that could introduce spurious variations should be excluded. The results of the present study indicate that when spectral analysis is performed it is important to consider the type of recording mode that will be used (bipolar or unipolar), since this factor can introduce variations, particularly in the parameters most closely related to the spectral frequency distribution, as occurs with the mean frequency.
Limitations
This study was performed using an experimental model and epicardial electrodes, a design that allowed adequate control of electrode positioning and the distance between the 2 components of the bipolar recordings, and facilitated analysis of differences related to the recording mode. Extrapolation of the results obtained to the clinical setting should take into account the characteristics of the model and the method used; specific studies for this purpose should be carried out.
CONCLUSIONS
The recording mode used (ie, unipolar or bipolar) introduces significant variations in the information obtained by spectral techniques during VF. These differences are mainly observed in the spectral frequency distribution, but are quite small in the case of the dominant frequency.
ABBREVIATIONS
DF: dominant frequency
MF: mean frequency
NSE: normalized spectral energy around the dominant frequency band (DF [1] Hz)
VF: ventricular fibrillation
This study was funded with aid from the Instituto de Salud Carlos III from the Ministry of Health and Consumer Affairs PI06/0758 and RETIC RD06/0003/0010 (REDINSCOR), as well as grant B2005 from the Sociedad Española de Cardiología (Spanish Society of Cardiology).
Correspondence: Dr. F.J. Chorro.
Servicio de Cardiología. Hospital Clínico Universitario.
Avda. Blasco Ibáñez, 17. 46010 Valencia. España.
E-mail: Francisco.J.Chorro@uv.es
Received February 16, 2007.
Accepted for publication June 26, 2007.