Keywords
INTRODUCTION
Conventional blood pressure (BP) monitoring performed in the doctor's office is commonly used to diagnose hypertension and evaluate the efficacy of treatment.1,2 However, from a pathophysiological point of view, the correlation in hypertension between the value of the BP and target organ damage, cardiovascular risk and prognosis for these patients is greater when the values are obtained by ambulatory blood pressure monitoring (ABPM) than when they are taken in the office.3
Most ABPM studies so far have been based on measurements taken over 24 hours. Thus, the criteria from an ABPM recording for both the diagnosis of hypertension1,2,4,5 and for the evaluation of antihypertensive therapy6 have been established from data obtained every 15-30 min over a single day. The sampling requirements and their possible influence on the diagnostic sensitivity, however, have been the subject of just a few studies.7,8 The reproducibility of the mean BP values has been shown to increase progressively with an increasing number of BP measurements.9 Additionally, the validity of ABPM versus the continuous intra-arterial measurement of BP has been established, demonstrating that the "true" mean BP value (obtained from continuous measurement) can be reproduced precisely by measuring at intervals of up to 30-60 min.10
These studies all examined the influence of the sample interval on reproducibility using recordings taken over 24 h but did not, therefore, evaluate the possible influence on the results of the duration of the measurement. Previous studies have indicated the possible advantages of ABPM over 48 h rather than just the usual 24 h in terms of reproducibility.11-13 The aim of this study was to evaluate the impact of the duration of the recording of ABPM and sampling frequency on the estimation of both the mean BP values (commonly used to diagnose hypertension) and the fall (relative drop in the mean nocturnal BP as compared with the diurnal BP, an index that determines whether a patient has a dipper or non-dipper pattern14) in persons with and without hypertension.
METHODS
Patients
The study included a total of 1450 untreated patients with essential hypertension (625 men and 825 women) and 378 volunteers without hypertension (182 men and 196 women). The mean age (the standard deviation) of the volunteers was 51.8 (14.4) years at the time of the study. For the purposes of this study, a diagnosis of hypertension required the mean 24 h systolic BP (SBP) /diastolic BP (DBP) to be above 130/80 mm Hg, or the mean diurnal figures to be over 135/85 mm Hg, or the mean nocturnal figures over 120/70 mm Hg.4,5 Volunteers were excluded if they were shift workers, consumed more than 80 g per day of alcohol or smoked more than 20 cigarettes per day, as were patients with secondary hypertension or cardiovascular or cerebrovascular disease, including angina pectoris, heart failure, ictus, nephropathy, retinopathy, a previous myocardial infarction or coronary revascularization.
The study was carried out at the Hypertension and Vascular Risk Unit of the Hospital Clínico Universitario in Santiago de Compostela, Spain. All the participants underwent a full clinical examination according to the standardized Unit protocol. The clinical measurements of the BP (six at each visit, just before starting the ABPM session, taken at 1 min intervals and after the subject had been seated for at least 5 min) were always done by the same researcher and using a validated and calibrated automatic device (HEM-737, Omron Care Inc., Vernon Hills, Illinois, US).15 This study, which formed part of a trial on the prognostic value of ABPM, was approved by the Clinical Research and Ethics Committee. The volunteers all gave informed consent prior to participating in the study.
Ambulatory Blood Pressure Measurement
The SBP, DBP, and heart rate of each subject were measured automatically each 20 min between 7:00 and 23:00 and each 30 min during the night for 48 consecutive hours with a validated and calibrated SpaceLabs 90207 device (SpaceLabs Inc., Redmond, Washington, US). None of the patients was hospitalized during the ABPM. The subjects continued their usual daily pattern of activities (from approximately 8:00 to 23:00 for most of them) and nocturnal rest during the days the ABPM was taken, under the usual conditions and with the minimum of restrictions. They were asked to follow a similar pattern of diurnal and nocturnal activities and to avoid an afternoon sleep (siesta) on the two days the ABPM was being taken.
Blood pressure recordings were eliminated from the series if the subject showed an irregular cycle of diurnal and nocturnal activity on the two days the ABPM was being taken, if he or she spent <6 h or >12 h resting at night, if the series contained more than three consecutive hours with no measurement of the BP, or if the subject had fewer than 70% of the expected number of BP recordings. The pressure cuff was always placed on the non-dominant arm, the circumference of which determined the cuff size. The ABPM was always started between 10:00 h and 12:00 h (mean, 11:09 [0:42]). During the days the recordings were being taken each subject filled in an activity diary indicating the times of going to bed, getting up, eating, exercise or unusual physical activity, and any events or emotional situation that could affect the BP.
Actigraphy
The volunteers also wore a Mini-Motion logger actigraph (Ambulatory Monitoring Inc., Ardsley, New York, US) on the wrist of the dominant arm in order to measure their physical activity each minute during the 2 days of ABPM. The actigraph data were used to determine the precise times of the start and end of the nocturnal resting cycle and diurnal activity cycle, in order to calculate the diurnal (activity) and nocturnal (resting) means of the BP for each patient.16 The advantages of using an actigraph rather than using predetermined time intervals to define the day and night, and thus to enable precise calculation of the diurnal and nocturnal means, have been shown previously.17
Statistical Analysis
The data on BP and heart rate were edited using the normal criteria to eliminate any anomalous values or outliers and errors of measurement.18 In particular, BP recordings with the SBP >250 or <70 mm Hg, DBP >150 or <40 mm Hg or the ambulatory pulse pressure (difference between the SBP and DBP) >150 or <20 mm Hg were automatically eliminated. The original series of BP was then subdivided (systematic elimination of data) to generate new series of data collected at 1-, 2-, 3-, or 4-hour intervals over the 48-hour period. In addition, two data series at the original measurement frequency were derived for the first and second 24-hour periods.
The concordance of the mean 24 h, daytime and night-time BP values was evaluated, as was the fall in the BP, and the values of these parameters were compared with the original series of ABPM and for each reduced group of ABPM series, in duration (48 to 24 h) and in sample frequency. The concordance limits between the original parameters and those obtained from the subdivided series were calculated using the Bland and Altman method.19,20 This analysis is based on the differences between the values (for each study parameter) obtained for each pair of ABPM series (original and reduced). These differences were represented graphically according to the mean of the two values. The concordance study is a more sensitive and suitable method than linear correlation for the detection of errors in the estimation of a variable when two methods of clinical measurement are compared.19,20
RESULTS
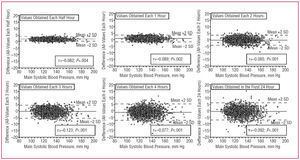
As an illustrative example, Figure 1 shows the concordance in the estimation of the daily mean of the SBP between the values obtained with the original series of ABPM and various sets of subdivided series of ABPM, which results in a sampling scheme that is less dense, in accordance with the procedure described above in the Methods section. Each of the Bland and Altman plots shows, on the vertical axis, the difference between the mean 24 h values of the SBP calculated from the original series and the values calculated from the reduced series. The horizontal axis represents the average of the two mean 24 h values of the SBP calculated for each subject (in the original series and the subdivided series). The average for all the study participants of the difference between the original mean value of the SBP and the value obtained in each subdivided series ranged from 1.2 mm Hg (for series in which sampling was done each 4 h for 48 h) to 0.7 mm Hg (for series in which sampling was done each half hour for 48 h) (Table 1). The results for the DBP were similar (right hand columns in Table 1). Although these mean differences appear low and have little clinical relevance, all were significantly different from zero.

Figure 1. Bland and Altman plots for the concordance value in the estimation of the mean daily systolic blood pressure (SBP) calculated from data sampled using measurements taken with ambulatory blood pressure monitoring (ABPM) each 20-30 min over 48 consecutive hours and from data sampled each half hour, each hour, each 2, 3, and 4 h over 48 h, as well as each 20-30 min over the first 24 h. The mean value of the differences for all the subjects is represented by the continuous horizontal line in each plot. The dotted lines represent the values of the mean differences (2 standard deviations).

Figure 1 shows that the values for the individual differences in the mean 24 h readings of the SBP between the original series and the reduced series were distributed homogenously over the average value of these differences (continuous horizontal line), with a slight, though significant (due to the large sample size) negative correlation, indicating a greater negative difference in the estimation of the mean value for higher SBP values. The plots in Figure 1 also show that the degree of lack of concordance in the estimation of the mean SBP rose progressively as the sampling frequency, and therefore the number of BP data used to calculate this mean, was reduced.
The results shown in Table 1 indicate that the variability in the estimation of the mean BP values (represented by the standard deviation [SD]) increased progressively with the loss of data and the use of less and less dense sampling. The discontinuous horizontal lines in the plots of Figure 1 represent the values of the average difference plus or minus 2 SD, respectively. The percentage of subjects with an individual difference within the margins delimited by these discontinuous lines is called the coverage (Table 1) and should approach 95% of the population under the hypothesis of normality. The range provides the maximum and minimum values of the individual differences obtained for each sampling scheme, while the length of the range is calculated as the difference between the extreme values of the range. Thus, the length of the range provides information about the maximum error that can be committed in the individual estimation of the mean BP depending on the sampling scheme used. Table 1 indicates that the length of the range of the individual differences is relatively short when the sampling frequency is one BP measurement each hour, increasing markedly with the progressive loss of information in the sampling schemes that only obtained one figure each 3 h or 4 h.
With respect to the impact of the duration of the ABPM, the results in Figure 1 and Table 1 show a greater dispersion and a greater length of range, and thus worse concordance, when the mean BP was estimated from the data obtained with the original frequency of 20-30 min over 24 h (maximum, 64 BP recordings per ABPM series) than when it was estimated from the data measured each 3 h or even each 4 h for 48 consecutive hours (maximum, 12 BP recordings per ABPM series). The total range of the difference in the estimation of the mean daily SBP between the original series and the subdivided ABPM series was 17 mm Hg for the data measured each 3 h over 48 h, increasing to 37 mm Hg for the data obtained each 20-30 min over 24 h, independently of whether the first or second of the two consecutive days of ABPM was used for the calculation. This error in estimation was even greater when the mean diurnal or nocturnal BP was calculated (Table 1). Identical conclusions were found from the columns providing the correlation values between the values calculated from the original data and each group of subdivided series. These correlations decreased progressively with the reduction in sampling frequency, and even more so when the series was shortened to just 24 h.
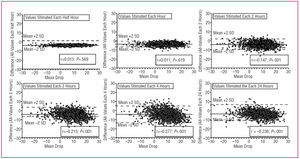
Bearing in mind the impact of the frequency and duration of the sampling in the estimation of the mean diurnal and nocturnal BP, we also examined the influence of the sampling scheme on the estimation of the fall in the BP (Figure 2 and Table 2). The results indicate the gradual increase in the lack of concordance with the progressive loss of data associated with the use of a less dense sampling scheme (Figure 2) and, more importantly, the absence of concordance and the dispersion in the estimation of the fall increased far more when the process of subdivision affected the duration of the ABPM series than when the subdivision affected the sampling frequency (Table 2). When the fall was calculated according to the first 24 h of ABPM (the most common procedure in clinical practice) there was a clear tendency to misclassify the subjects with a non-dipper profile (subjects with a fall <10%) and characterized them as dippers. However, the opposite (classifying a dipper as a non-dipper) was more usual when the fall was calculated according to the second 24 h of ABPM. The percentage of errors in the classification of subjects as dippers or non-dippers was greater when the data used corresponded to those obtained each 20-30 min over 24 h than with measurement series each 3 h over 48 h. The negative correlation values shown for these cases in Figure 2 indicate a marked tendency to underestimate the true value of the fall in the non-dipper patients when the 24 h ABPM was used. Even though the total percentage of errors in the classification obtained when just the 24 h data were used could be considered relatively small (15%), the total range of the possible error in the individualized estimation of the fall was four times the difference in the fall between the dipper and the non-dipper patterns.

Figure 2. Bland and Altman plots to evaluate the concordance in the estimation of the fall in the systolic blood pressure (SBP) (relative drop in the mean nocturnal with respect to the mean diurnal blood pressure reading) calculated from data sampled using ambulatory blood pressure monitoring (ABPM) each 20-30 min over 48 consecutive hours and from data sampled each half hour, each hour, each 2, 3, and 4 h over 48 h, as well as each 20-30 min over the first 24 h. The mean value of the differences for all the subjects is represented by the continuous horizontal line in each plot. The dotted lines represent the values of the mean difference (2 standard deviations).

DISCUSSION
This stud y of the impact of the frequency of sampling and the duration with ABPM on the correct estimation of the parameters used to diagnose hypertension, provide a prognosis and assess therapeutic efficacy in patients with hypertension shows that this estimation depends far more on the duration of the ABPM than on sampling frequency. Figure 1 shows that the mean BP can be estimated with greater precision when the measurement time is extended to 48 h, even with an important reduction in sampling frequency. The results shown in Table 1 indicate that the range of error in the estimation of the mean BP can surpass 35 mm Hg when the calculation is done using the data obtained during the 24 h measurement, a clearly unacceptable potential error in clinical practice and which results in an increased cost/benefit ratio of ABPM.
The average individual difference in the estimation of the mean BP values (Table 1) was very small, though at all times statistically significant, and consistently below 2 mm Hg, independently of the ABPM sampling frequency and duration. These results corroborate the apparent reproducibility of ABPM from the populational point of view21 and could lead to the mistaken conclusion that ABPM is highly reproducible independently of the sampling frequency and measurement duration. However, Table 1 reflects the lack of concordance in the individual estimation of the mean BP values associated with the progressive loss of data and especially with the reduction in the duration of ABPM.8
The results corroborate the foreseeable progressive loss of reliability in the estimation of diagnostic parameters derived from the ABPM associated with the reduction in sampling frequency.9 The increased dispersion in the estimation of the mean BP values associated with the loss of data (Table 1) indicates that the adequate evaluation of the BP in any given patient requires the sampling interval to be no greater than 30-60 min.10 The present study corroborates the results of a previous trial carried out in the setting of gestational hypertension,8 which showed that the loss of reliability depended more on the reduction of the measurement duration. Thus, the concordance between the mean BP values and the fall with respect to the values obtained with all the available data (original series) is lost far more notably when the duration of the ABPM is reduced to 24 h (64 possible BP values) than when the sampling frequency is reduced to one reading every 3 h (16 possible BP values). For an almost equivalent number of BP measurements, the potential range of error is four times greater with an ABPM of 24 h and a sampling interval of 20-30 min (64 BP values) than with an ABPM of 48 h and a sampling interval each hour (48 BP values) (Table 1).
Although most studies on the circadian variability of BP so far published have been based on 24 h ABPM recordings, measurement over 48 h has been shown to have important advantages for the analysis of the variability of BP, the diagnosis of hypertension and the evaluation of the response of a patient to antihypertensive treatment.8,11-13 Moreover, important changes in BP may take place between one day and the next, due in part to differences in the daily activities and the influence of external stimuli (intake of food, consumption of alcohol and caffeine, emotional state, changes in the cycle of activity and rest, physical exercise, etc.) which can, at least partly, be taken into account when measurements are made over 48 h. ABPM studies of up to seven consecutive days, however, have shown that the extension of the duration of the ABPM beyond 48 h only provides a marginal increase in reliability in relation with the increased cost of the ABPM and the trouble experienced by the patient associated with the prolonged measurement period.22
With respect to the possible influence of the duration of the ABPM in the diagnosis of hypertension, hypertensive patients who undergo the measurement for the first time experience a significant reduction in the diurnal mean BP on the second day in comparison with the first day. This "ABPM effect" increases the SBP and DBP by an average of 7 and 5 mm Hg, respectively, over the first four hours of measurement and persists significantly during the first ten hours of the ABPM.12,13 As a consequence of this effect, one third of the patients with a dipper pattern on the first ABPM day were classified as non-dippers on the second measurement day.12 Considering that the adequate classification of a patient as a dipper or non-dipper depends on the correct estimation of the mean diurnal and nocturnal BP measurements, the results depicted in Table 2 show that extending the duration of the ABPM to 48 h is associated with a significant reduction in the greater than 35% uncertainty in the dipper classification of hypertense patients.11 The results shown in Tables 1 and 2 indicate that if the aim of the ABPM includes both the adequate estimation of the diagnostic and prognostic parameters as well as the appropriate classification of the dipper profile of the patient, the ABPM should be carried out with a sampling interval no greater than one recording each hour over 48 consecutive hours.
CONCLUSIONS
In conclusion, this study in subjects who underwent BP monitoring for 48 consecutive hours shows that the estimation of the diagnostic parameters derived from the ABPM depends far more on the duration of the recordings than on the sampling frequency. Thus, the mean daily, diurnal and nocturnal BP values and the fall in the BP can be reproduced with greater reliability if taken from data obtained each three hours over two days than with data sampled each 20-30 min over 24 h, in spite of the fact that in the latter case the number of BP measurements is four times higher than in the former case. The results indicate that in order to minimize the possible range of error, the ABPM should be carried out over 48 consecutive hours and with a sampling interval no greater than one hour. Finally, the results also show that a 24 h ABPM is not sufficient for the correct diagnosis of hypertension, the identification of a dipper or non-dipper pattern in the patient or the evaluation of the therapeutic efficacy and the degree of control in patients receiving antihypertensive treatment.12
This study was supported in part by the Dirección General de Investigación, Ministerio de Educación y Ciencia (SAF2006-6254); Xunta de Galicia (PGIDIT03-PXIB-32201PR), Vicerrectorado de Investigación, Universidad de Vigo, and the Hospital Clínico Universitario de Santiago
Correspondence: Prof. R.C. Hermida.
Laboratorio de Bioingeniería y Cronobiología. ETSI. Telecomunicación.
Campus Universitario. 36200 Vigo. Pontevedra. España.
E-mail: rhermida@uvigo.es
Received February 1, 2006.
Accepted for publication September 28, 2006.