Treatment of acute myocardial infarction has changed notably in recent years. The objective of this study was to analyze trends in in-hospital mortality during the period 2003-2009 and to examine how changes in comorbidity indices affected mortality prediction models for acute myocardial infarction using the minimum basic data set.
MethodsDuring the study period, 5275 cases of acute myocardial infarction were admitted. Mortality rates were calculated by age and sex and Charlson and Elixhauser comorbidity index scores were obtained on admission for every patient. Trends were analyzed and their validity studied. Multivariate models predictive of mortality were derived and compared.
ResultsMean age and comorbidities increased in all patients over the period 2003-2009. In spite of these trends, acute myocardial infarction mortality decreased. Comorbidity indices remained valid when the criterion “present on admission” was applied. Multivariate predictive models included age, sex, medical treatment, coronary revascularization and a comorbidity index or specific comorbidities. The model with specific comorbidities showed the best predictive ability. All models found that age and comorbidities increased the risk of death, and that coronary revascularization and treatment with anticoagulants, fibrinolytics, and platelet antiaggregants were protective factors.
ConclusionsDespite the fact that the mean age and number of comorbidities in acute myocardial infarction patients has increased year over year, acute myocardial infarction mortality has decreased, probably because of more frequent reperfusion and revascularization therapy and better medical treatment.
Keywords
.
INTRODUCTIONThe United States’ Agency for Healthcare Research and Quality (AHRQ) quality of care indicators are calculated using hospital discharge data and are used to monitor the quality of health care. Acute myocardial infarction (AMI) is one of the indicators of hospital mortality. The AHRQ's quality of care protocols provide a set of inclusion and exclusion criteria to determine which AMI cases should be included in the analysis of mortality.1.
However, hospital mortality due to AMI also depends on other factors. Patient age is associated with an increased risk of complications and poor prognosis, while the presence of comorbidities on admission with an AMI may adversely affect prognosis, with some combinations of comorbidities directly affecting mortality.2, 3.
Our hospital has developed a system for monitoring quality of care indicators which follows the AHRQ case definition criteria and uses the Minimum Basic Data Set (MBDS). The impact of mortality is assessed by calculating specific mortality rates by age group and sex. To assess the impact of comorbidities on mortality, the Charlson4 and Elixhauser5 comorbidity indices are calculated for each patient on admission from diagnoses coded using the Ninth International Classification of Diseases (ICD-9).6, 7.
These comorbidity indices are, however, calculated from secondary diagnoses which in some cases may have occurred after the patient was admitted. The POA (present on admission) indicator, which indicates if the patient already had the diagnosis at the time of admission,8 was included in the MBDS in 2009. Thus, from 2009 on, these indicators can be calculated with greater reliability, as diagnoses that were not present at the time of admission are excluded. The objectives of the present study were: a) to analyze trends in mortality due to AMI during the period 2003-2009; b) to study trends in Charlson and Elixhauser index scores in patients with AMI during the same period; c) to analyze the validity of the comorbidity indicators after applying the POA criterion, and d) to assess the importance of comorbidities in several AMI mortality prediction models.
METHODS Defining a Case of Acute Myocardial InfarctionWe applied the AHRQ inclusion and exclusion criteria for AMI patients. Thus, all cases included were 18 years of age or older with a record of the cause of discharge. Patients excluded were those transferred to facilities outside the hospital area and women treated for pregnancy, childbirth, or postpartum. Algorithms were used which identified cases of AMI as those with diagnostic codes which include initial AMI as a primary cause of admission (410.01, 410.11, 410.21, 410.31, 410.41, 410.51, 410.61, 410.71, 410.81 and 410.91).
Mortality RatesCrude mortality rates and age- and sex-specific mortality rates (expressed as percentages) were calculated by dividing the number of deaths from AMI by the number of AMI cases in each subgroup. Only cases of AMI in patients aged 18 or older were analyzed.
ComorbidityAlgorithms were developed to calculate the Charlson and Elixhauser index scores from the secondary diagnoses in discharge data for each patient.4, 5, 6, 7, 9 The indices were adapted for use with the ICD-9.
The Charlson index assigns weights to 17 disease-specific groups, most of which are given a weight of 1. Diabetes mellitus with organ involvement, hemiplegia, severe and moderate renal disease, and any cancerous tumor, leukemia or lymphoma are assigned a weight of 2. Moderate or severe hepatic disorders are assigned a weight of 3, and metastatic solid tumors and AIDS a weight of 6. The index is calculated by adding the weights for each condition in each patient. The Elixhauser index assigns a weight of 1 to each of 30 groups of specific diseases. The components of each index are presented below.
As well as calculating these indices, we also performed an exhaustive analysis of specific comorbidities. For the 2009 results, we compared the incidence of these specific comorbidities with and without the POA indicator. Cases with a positive POA were considered the standard, and a comparison was made with these same patients but without applying the POA criterion. We analyzed whether there were statistically significant differences with and without POA, and the specificity and positive predictive value of the diagnosis of comorbidity without POA were calculated for each comorbidity.
Finally, three multivariate models were developed to predict mortality from AMI. The first included the variables age, sex, medical treatment with anticoagulants, thrombolytic and antiplatelet drugs, use of coronary surgery (procedure codes of ICD-9 36.0-36.99) and the Charlson comorbidity index. The second contained the same variables, but used the Elixhauser comorbidity index instead of the Charlson. In the third model, the Charlson and Elixhauser indices were replaced with the specific comorbidity indices.
Statistical AnalysisFor continuous variables, the difference between two means was assessed using the Student t test or its nonparametric equivalent, the Mann-Whitney test. Where more than two means were compared, analysis of variance or its nonparametric equivalent, the Kruskal-Wallis test, were used.
For dichotomous independent variables, we measured the magnitude of association using relative risk (RR) and the odds ratio (OR). Relative risk was measured using the ratio of cumulative incidence risk. Statistical significance was measured using χ2, and 95% confidence intervals (95%CI) were calculated for RR and OR. Unconditional logistic regression was used to perform multivariate analysis of mortality patterns, after analyzing for confounding and excluding collinearity.
The method recommended by Hanley et al,10, 11 was used to compare the area under the curve (AUC) of the ROC curves for each multivariate predictive model.
Algorithms were programmed and the statistical analysis carried out in Stata 11 MP.
RESULTSDischarges over the period 2003-2009 were analyzed. After applying the algorithms, 5275 cases of AMI were identified (5180 in Hospital Universitario Virgen Macarena and 95 at the Hospital de San Lázaro) in the coronary intensive care unit, department of cardiology, or department of internal medicine. Sample characteristics are shown in Table 1. Mean age was 67.4 years for men and 76.7 years for women. The number of AMI cases admitted increased from 2003 onwards, with more men than women admitted. The mean age of men and women admitted with AMI also increased, though more so in women, and the number of comorbidities in those hospitalized with AMI on admission also rose.
Table 1. Number of Cases of Acute Myocardial Infarction, Mean Age of Cases in Men and Women, Male / Female Ratio, and Average Scores on the Charlson and Elixhauser Indices on Admission for the Period 2003-2009.
| Year | Discharges with AMI, no. | Mean age of men with AMI, years | Mean age of women with AMI, years | Ratio men / women | Mean Charlson index score on admission | Mean Elixhauser index score on admission |
| 2003 | 707 | 64.9 | 74.8 | 1.87 | 1.26 | 1.45 |
| 2004 | 741 | 68.1 | 76.5 | 1.64 | 1.43 | 1.59 |
| 2005 | 731 | 67.1 | 76.2 | 1.79 | 1.39 | 1.71 |
| 2006 | 747 | 67.5 | 76.5 | 1.47 | 1.31 | 1.78 |
| 2007 | 780 | 68.1 | 77.5 | 1.68 | 1.38 | 1.86 |
| 2008 | 798 | 68.4 | 77.2 | 1.61 | 1.75 | 2.28 |
| 2009 | 771 | 67.9 | 77.8 | 1.98 | 1.66 | 2.26 |
| 2003-2009 | 5275 | 67.4 | 76.7 | 1.71 | 1.45 | 1.86 |
| Test for trend, P | <.0001 | <.0001 | <.0001 | — | <.0001 | <.0001 |
AMI, acute myocardial infarction.
An analysis of the evolution of comorbidity index scores on admission in patients with AMI shows that every year the mean of the two indices was greater in those who died than in those who did not. The differences were statistically significant in most cases. It can also be seen that the mean values of both indices increased steadily over time in both those who died and those who did not (Table 2).
Table 2. Comparison of Mean Scores on the Charlson and Elixhauser Comorbidity Indices in acute myocardial infarction Patients Alive at Discharge and Those Who Died During Hospital Stay.
| Year | Mean Charlson index score in AMI patients alive | Mean Charlson index score in AMI patients who died | P | Mean Elixhauser index score in AMI patients alive | Mean Elixhauser index score in AMI patients who died | P |
| 2003 | 1.17 | 1.79 | <.0001 | 1.41 | 1.67 | .0155 |
| 2004 | 1.33 | 2.03 | <.0001 | 1.58 | 1.66 | .2567 |
| 2005 | 1.30 | 1.94 | <.0001 | 1.68 | 1.83 | .1136 |
| 2006 | 1.22 | 1.92 | <.0001 | 1.75 | 2.04 | .0167 |
| 2007 | 1.31 | 1.91 | <.0001 | 1.84 | 1.99 | .1598 |
| 2008 | 1.66 | 2.55 | <.0001 | 2.25 | 2.58 | .0319 |
| 2009 | 1.53 | 2.29 | <.0001 | 2.18 | 2.41 | .0670 |
| 2003-2009 | 1.37 | 2.10 | <.0001 | 1.83 | 2.01 | .0006 |
| Test for trend, P | <.0001 | <.041 | — | <.0001 | <.0001 | — |
AMI, acute myocardial infarction.
The AMI mortality rates during the period studied are shown in Table 3. If, due to their small numbers, we ignore the oscillations in the 40-59 age group it can be seen that mortality rates declined steadily from 2003 to 2009. The decrease is most clearly observed in men; in women, despite the decrease in mortality over the period 2003-2008, there was a momentary rise in mortality in 2009, particularly in the 80 years and over age group.
Table 3. Trends in Acute Myocardial Infarction Mortality Rates by Age Group and Sex, 2003-2009.
| Year | Mortality rate, men (×100) (95%CI) | Mortality rate, women (×100) (95%CI) | Mortality rate, both sexes (×100) (95%CI) | |||||||||
| 40-59 years | 60-79 years | ≥80 years | All | 40-59 years | 60-79 years | ≥80 years | All | 40-59 years | 60-79 years | ≥80 years | All | |
| 2003 | 6.1 (2.8-11.2) | 15.3 (11-20.4) | 20.4 (10.6-33.5) | 12.4 (9.5-15.5) | 0 | 16.2 (10.3-23.6) | 20.9 (13.1-30.7) | 16.2 (11.8-21.4) | 5.3 (2.5-9.9) | 15.6 (12-19.6) | 20.7 (14.4-28.2) | 13.7 (11.3-16.5) |
| 2004 | 2.5 (0.5-7.1) | 12 (8.3-16.6) | 22.7 (13.8-33.8) | 11.1 (8.4-14.3) | 14.3 (1.8-42.8) | 14.5 (9.5-20.9) | 20.8 (13.3-30) | 16.7 (12.5-21.6) | 3.7 (1.2-8.5) | 13 (9.9-16.6) | 21.6 (15.7-28.4) | 13.2 (10.9-15.9) |
| 2005 | 4.1 (1.3-9.1) | 15.4 (11.4-20.3) | 26.9 (16.8-39.1) | 13.9 (10.9-17.3) | 4.5 (0.1-22.8) | 15.2 (9.7-22.3) | 21.6 (14-30.8) | 16.8 (12.5-21.9) | 4.1 (1.5-8.8) | 15.4 (12-19.2) | 23.7 (17.5-30.8) | 14.9 (12.4-17.7) |
| 2006 | 3.5 (1-8.7) | 13.1 (9.1-18) | 17.9 (10.3-27.8) | 11.2 (8.4-14.5) | 4 (0.1-20.3) | 9.1 (4.9-15) | 18.2 (12-25.8) | 12.6 (9.1-16.9) | 3.6 (1.2-8.1) | 11.6 (8.5-15.2) | 18.1 (13.2-23.8) | 11.8 (9.6-14.3) |
| 2007 | 0.8 (0.02-4.4) | 9.4 (6.1-13.5) | 25.3 (16.7-35.5) | 10.2 (7.7-13.3) | 0 | 11.1 (6.5-17.4) | 16.3 (10.4-23.8) | 12.7 (9.1-17.1) | 0.7 (0.02-3.9) | 10 (7.2-13.3) | 20 (14.9-25.9) | 11.2 (9-13.6) |
| 2008 | 0.9 (0.02-4.7) | 10.9 (7.4-15.4) | 17.3 (10.7-25.6) | 9.8 (7.3-12.7) | 7.7 (0.9-25.1) | 7.8 (3.8-13.8) | 12.1 (7.3-18.4) | 9.8 (6.7-13.7) | 2.1 (0.4-6) | 9.8 (7.1-13.3) | 14.3 (10.3-19.1) | 9.8 (7.8-12) |
| 2009 | 2.1 (0.4-6.1) | 10.9 (7.3-15.6) | 14.4 (8.8-21.8) | 9.2 (6.8-12) | 6.3 (0.2-30.2) | 9.2 (4.5-16.2) | 27.5 (20-36) | 18.1 (13.6-23.4) | 2.6 (0.7-6.4) | 10.4 (7.4-14.1) | 21.1 (16.3-26.6) | 12.2 (10-14.7) |
95%CI, 95% confidence interval.
Table 4 shows the proportions of males and females and the total of 2009 AMI patients with each of the specific comorbidities included in the Charlson and Elixhauser indices, as well as the annual percent change (positive or negative) over the period 2003-2009, and the trend test. Each comorbidity in 2009 was calculated using the positive POA indicator.
Table 4. Analysis of Specific Comorbidities on Admission and Annual Rate of Change for the Period 2003-2009 in Patients With Acute Myocardial Infarction.
| Comorbidity | AMI with comorbidity in 2009, % | Annual rate of changes over the period, 2003-2009, % | Trend, P | Comorbidity index in which included |
| Congestive heart failure | 24.9 | +3.4 | .0420 | Charlson and Elixhauser |
| Arrhythmias | 34.9 | +0.4 | .0350 | Elixhauser |
| Valve disease | 19.2 | +13.5 | <.0001 | Elixhauser |
| Pulmonary vascular diseases | 5.1 | +14.7 | .0010 | Elixhauser |
| Peripheral vascular disease | 10.8 | +3.5 | .0580 * | Charlson and Elixhauser |
| Hypertension without complications | 49.3 | +3.1 | .0010 | Elixhauser |
| Hypertension with complications | 17.5 | +13.2 | <.0001 | Elixhauser |
| Cerebral vascular disease | 7.4 | +2.7 | .0420 | Charlson |
| Paralysis | 2.3 | +1.7 | .1890 * | Charlson and Elixhauser |
| Other neurological disorders | 5.7 | +8.3 | .0050 | Charlson and Elixhauser |
| Chronic pulmonary disease | 15.7 | +3.9 | .0280 | Charlson and Elixhauser |
| Diabetes mellitus without complications | 38 | +2.9 | .0450 | Charlson and Elixhauser |
| Diabetes mellitus with complications | 8 | +5.9 | .0420 | Charlson and Elixhauser |
| Hypothyroidism | 5.2 | +27 | <.0001 | Elixhauser |
| Kidney disease | 10.6 | +15.5 | <.0001 | Charlson and Elixhauser |
| Liver disease | 2.3 | +6.2 | .0090 | Charlson (a, mild, and b, moderate or severe) and Elixhauser |
| Peptic ulcer | 0.5 | –1.5 | .9490 * | Charlson and Elixhauser |
| AIDS | 0.3 | +14.3 | .5330 * | Charlson and Elixhauser |
| Lymphomas | 0.1 | -11.5 | .3930 * | Charlson and Elixhauser |
| Metastatic cancer | 0.7 | +9.1 | .4020 * | Charlson and Elixhauser |
| Nonmetastatic cancer | 3.4 | +40.1 | <.0001 | Charlson and Elixhauser |
| Rheumatic diseases | 1.8 | +19 | .0910 * | Charlson and Elixhauser |
| Coagulopathies | 2.2 | +26.5 | .0060 | Elixhauser |
| Obesity | 9 | +19.7 | <.0001 | Elixhauser |
| Other weight disorders | 0.3 | +14.3 | .9000 * | Elixhauser |
| Electrolyte disorders | 4.2 | +24 | .0030 | Elixhauser |
| Posthemorrhagic anemia | 0.4 | –10.1 | .6310 * | Elixhauser |
| Deficiency anemia | 7.9 | +60.9 | <.0001 | Elixhauser |
| Alcohol-related problems | 4 | –0.9 | .9960 * | Elixhauser |
| Drug-related problems | 1.2 | +17.5 | .0980 * | Elixhauser |
| Psychosis | 1.2 | +53 | .0990 * | Elixhauser |
| Depression | 3.6 | +16.2 | .0010 | Elixhauser |
AIDS, acquired immune deficiency syndrome; AMI, acute myocardial infarction.
* Not statistically significant (P>.05).
The results of comparing specific comorbidities in 2009 patients with AMI when the proportion of those calculated with POA did not match the proportion of those calculated without POA are shown in Table 5. In all cases, we tested for statistically significant differences and estimated the specificity and positive predictive value of the no-POA rate when compared to the standard rate (with POA) in order to quantify the impact of these false positives in comorbidities at the time of admission. We found moderate differences in prevalence, but none were statistically significant. The impact on specificity was minimal (the lowest value was 94.3%) and almost all the positive predictive values exceeded 85% except for liver disease in women, where a PPV of 60% was observed.
Table 5. Comparison of the Proportion of Patients With Specific Comorbidities for Which Differences Were Found Between Comorbidity Calculated With and Without Taking Into Account Whether the Secondary Diagnosis Was Present on Admission.
| Comorbidity | Men | Women | Both sexes | ||||||||||||
| Proportion on admission without POA, % | Proportion on admission with POA, % | P | NVR, % | PPV, % | Proportion on admission without POA, % | Proportion on admission with POA, % | P | NVR, % | PPV, % | Proportion on admission without POA, % | Proportion on admission with POA, % | P | NVR, % | PPV, % | |
| Congestive heart failure | 20.5 | 19 | .53 | 98.1 | 92.4 | 37.5 | 36.7 | .86 | 98.8 | 97.9 | 26.2 | 24.9 | .56 | 98.3 | 95.1 |
| Cerebrovascular disease | 7 | 6.6 | .80 | 99.6 | 94.4 | 10 | 8.9 | .65 | 98.7 | 88.5 | 8 | 7.4 | .63 | 99.3 | 91.9 |
| Arrhythmias | 35 | 31.1 | .18 | 94.3 | 88.8 | 45.6 | 42.5 | .48 | 94.6 | 93.2 | 38.5 | 34.9 | .14 | 94.4 | 90.6 |
| Valve disease | 13.7 | 12.9 | .71 | 99.1 | 94.3 | 33.2 | 31.7 | .71 | 97.7 | 95.4 | 20.2 | 19.2 | .61 | 99 | 96.1 |
| Hypertension without complications | 47.3 | 47.1 | .95 | 99.6 | 99.6 | 54.1 | 53.7 | .93 | 99.2 | 99.3 | 49.5 | 49.3 | .92 | 99.5 | 99.5 |
| Paralysis | 2.2 | 2.2 | 1 | 100 | 100 | 3.1 | 2.7 | .79 | 99.6 | 87.5 | 2.5 | 2.3 | .87 | 99.9 | 94.7 |
| Other neurological disorders | 4.7 | 4.7 | 1 | 100 | 100 | 8.1 | 7.7 | .87 | 99.6 | 95.2 | 5.8 | 5.7 | .91 | 99.9 | 97.8 |
| Liver disease | 3.1 | 2.9 | .86 | 99.8 | 93.8 | 1.9 | 1.2 | .48 | 99.2 | 60 | 2.7 | 2.3 | .63 | 99.6 | 85.7 |
| Electrolyte disorders | 3.1 | 2.9 | .86 | 99.8 | 93.8 | 7.7 | 6.6 | .61 | 98.8 | 85 | 4.7 | 4.2 | .62 | 99.5 | 88.9 |
NVR, negative value rate (“specificity”); POA, present on admission; PPV, positive predictive value.
P, probability calculated using χ2 test.
To assess the impact of comorbidities on AMI mortality, multivariate predictive models were developed which included age, sex, medical treatment, and coronary revascularization. Before the multivariate analysis, we examined whether coronary revascularization and medical treatment had influenced outcome. Bivariate analysis showed an association between revascularization and decreased mortality in patients admitted during the period 2003-2009 (RR=0.27, 95%CI, 0.23 to 0.33, P<.0001). We also examined whether there was a relationship between medical treatment and prognosis in these patients, and found a protective effect during the same period (RR=0.57, 95%CI, 0.44 to 0.74, P<.0001). Both variables (medical treatment and coronary revascularization) were therefore included in all of the regression models.
Three predictive models were developed that included medical treatment, coronary revascularization, patient sex, and age in years. In the first, comorbidites were included using the Charlson index, in the second using the Elixhauser index, and in the third all specific comorbidities were included. The results are shown in Table 6. All models identified medical treatment and coronary revascularization as having a possible protective effect. When discharges occurring during the first 48h were omitted, the hypothesized protective effect was maintained, so all cases were included in the model. In all models, the presence of comorbidities at the time of admission was a negative prognostic factor, both when using either of the indices or when comorbidities were included individually. In the third model, 4 specific comorbidities persisted as risk factors for mortality, with a maximum RR in the case of congestive heart failure (OR=2.97), followed by other neurological disorders, electrolyte imbalance, and arrhythmias.
Table 6. Multivariable Models to Predict Mortality on Admission in Patients With Acute Myocardial Infarction. Unconditional Logistic Regression Analysis for the Period 2003-2009.
| Model A | Model B | Model C | |||||||||
| Variables | OR | 95%CI | P | Variables | OR | 95%CI | P | Variables | OR | 95%CI | P |
| Medical treatment | 0.55 | 0.41-0.74 | <.0001 | Medical treatment | 0.54 | 0.40-0.73 | <.0001 | Medical treatment | 0.56 | 0.42-0.76 | <.0001 |
| Age | 1.04 | 1.03-1.05 | <.0001 | Age | 1.04 | 1.03-1.05 | <.0001 | Age | 1.03 | 1.02-1.04 | <.0001 |
| Male | 1.21 | 1-1.45 | .0430 | Male | 1.30 | 1.09-1.56 | .0040 | Male | 1.40 | 1.16-1.69 | <.0001 |
| Coronary revascularization | 0.36 | 0.29-0.44 | <.0001 | Coronary revascularization | 0.30 | 0.24-0.38 | <.0001 | Coronary revascularization | 0.39 | 0.32-0.49 | <.0001 |
| Charlson index | 1.17 | 1.11-1.23 | <.0001 | Elixhauser index | 1.14 | 1.07-1.22 | <.0001 | Congestive heart failure | 2.97 | 2.47-3.56 | <.0001 |
| Arrhythmias | 1.61 | 1.36-1.93 | <.0001 | ||||||||
| Other neurological disorders | 2.84 | 2.07-3.89 | <.0001 | ||||||||
| Electrolyte disorders | 1.84 | 1.25-2.69 | .0020 | ||||||||
95%CI, 95% confidence interval; model A, multivariate model that includes medical treatment (anticoagulants, fibrinolytic, and antiplatelet agents), age in years, sex, coronary revascularization (Ninth International Classification of Disease [ICD-9] procedure codes 36.0-36.99), and the Charlson comorbidity index on admission; model B, multivariable model that includes medical treatment (anticoagulants, fibrinolytic, and antiplatelet agents), age in years, sex, coronary revascularization (ICD-9 procedure codes 36.0-36.99), and the Elixhauser comorbidity index on admission; model C, multivariable model that includes medical treatment (anticoagulants, fibrinolytic, and antiplatelet agents), age in years, sex, coronary revascularization (ICD-9 procedure codes 36.0-36.99), and specific comorbidities on admission; OR, odds ratio.
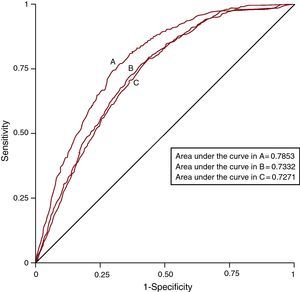
ROC curves were developed for each multivariate model and the AUC were measured and compared between models. The results are shown in Figure 1. These show that the model including specific comorbidities best explained AMI mortality (AUC=0.7853), followed by the model that incorporated the Charlson comorbidity index (AUC=0.7332) and, lastly, that which included the Elixhauser comorbidity index (AUC=0.7271). The differences were statistically significant in all comparisons of AUC predictive models of mortality, ie, when comparing the specific comorbidities model with the Charlson index model (P<.0001) and the Elixhauser index model (P<.0001), and when comparing the Charlson index model with the Elixhauser index model (P=.027).

Figure 1. ROC curves of the three multivariate models used to predict mortality from acute myocardial infarction over the period 2003-2009. A, predictive model with specific comorbidities. B, predictive model with Charlson comorbidity index. C, predictive model with Elixhauser comorbidity index.
DISCUSSIONThis study has some limitations. The data used were those contained in the MBDS and were not complemented with additional data from patients. The analysis was limited to mortality during hospital stay because data on medium to long patient outcomes were not available. As regards the reliability of the diagnoses of cases of AMI, AHRQ criteria were followed, but other biases may have occurred. The difficulty in defining the root cause in a patient who was admitted with many concurrent illnesses and no available history can influence the quality of diagnoses in the clinical record and, therefore, in the MBDS.
Another limitation is potential underreporting if all of the information required by coders to complete the codes is not available in the discharge report. Likewise, the interpretation of information may vary between coders. This would primarily affect the validity of the comorbidity algorithms. Comorbidities do not correspond to a single precise clinical diagnosis, but to diagnostic groups coded according to the ICD-9.
In the study center, coding is performed by professional coders working from patient discharge reports, which are in turn completed by the discharging physician. The regulations are fully explained in various publications aimed at coders,8 and follow-up reduces coder-produced information bias, but cannot completely eliminate it. There were no major changes in the codes during the period 2003-2009 and no significant changes in coder work patterns or the structure of the team during that period.
Databases such as the MBDS also have clear advantages.12, 13 The data collected are usually completed in most hospital admissions and, as they include virtually all cases, provide reasonably accurate estimates of the incidence, prevalence, comorbidity, and mortality of diseases treated in the hospital setting. The data can be analyzed retrospectively, unlike other designs that require prospective data collection, and data from long periods or from large numbers of patients can be gathered quickly and easily. Since the data are collected systematically, costs are considerably reduced. In studies based on these databases, there may be less selection bias due to the refusal of patients or their legal representatives to sign consent forms which would allow the patient to participate in the study. Finally, these comorbidity indices can be used in other studies in which these patients participate, such as clinical trials or observational studies.
During the period 2003-2009, there was a considerable increase in comorbidities in patients admitted with AMI. This increase was detected with both indices. While some studies of mortality from AMI in Spain have used the Charlson index,14, 15 we found none that employed the Elixhauser index and compared it with the performance of the Charlson. It is possible that this is the first study in Spain to use this index in the evaluation of AMI mortality, although several studies on mortality from AMI in other countries have used it.16, 17, 18, 19, 20 Both indices can be calculated easily from data in the MBDS and its reliability will be enhanced with the addition of POA indicator.
Scores on the comorbidity indices increased both in patients who died and in survivors. The analysis of specific comorbidities confirms the upward trend in the proportions of AMI patients admitted with these comorbidities.
Despite an increase in mean age and a greater number of comorbidities in AMI patients, mortality continued to decline, a fact which speaks for the constant improvement of standards of care in the departments involved in caring for these patients. Mortality from AMI has declined in developed countries in recent years, and studies have attributed the decline in mortality of 35% to 50% over the period 1980-2000 to the use of treatment guidelines and clinical protocols.21 This improvement in prognosis extends to those with a recurring AMI.22 Studies performed recently in Spain analyzed the evolution of in-hospital and medium term mortality and found that notable declines had occurred.23, 24 Explanations for the improvement have included an increased use of reperfusion therapy, higher rates of percutaneous and surgical revascularization, and, probably, improvements in medical treatment.25 The results observed in the present study are therefore in line with expectations of improved quality of care and could be attributed to all of these factors.
This study found an association suggesting a possible protective effect (RR <1) of coronary revascularization against AMI mortality. Some studies have found that application of these procedures reduced the risk of hospital mortality for AMI,26 although others have not been able to show that improved prognosis continues through the medium and long term,27, 28 so much of this improvement can be attributed at least in part to medical treatment on admission.25 In this study, the protective effect of coronary revascularization and medical treatment persisted in all multivariate models, indicating that both factors may have played a part in reducing AMI hospital mortality over the study period. One limitation was that we did not include other drugs which can influence prognosis, such as statins, beta blockers, and others, as these are not included in the MBDS. It was also not possible to include other predictors such as electrocardiographic changes or the magnitude of elevation of AMI markers in the model.
The model which included specific comorbidities was better at predicting risk of mortality than the models which included a comorbidity index. Other researchers have also found that the inclusion of specific comorbidities improves the predictive ability of models,29 but the ease of calculation and the systematic implementation of the Charlson index and Elixhauser index are advantages to consider. As the variables in the MDBS are collected in all Spanish hospitals, calculation of these indices and the development of models to predict AMI mortality could be performed systematically in all hospitals within the National Health Service and could be used to analyze the quality of care.
Comparative analysis of the prevalence of comorbidity with and without the POA indicator showed differences in only a small number of comorbidities in the year studied. Furthermore, the differences were not statistically significant and did not influence specificity. The impact on predictive values was also small. These results should, however, be treated with caution as they may have differed for the period 2003-2008. The fact that all diagnoses in the MDBS will be accompanied by the POA indicator in the future will make it possible to validate these findings.30.
In 2010, those aged 65 years or over made up 17.2% of the Spanish population and 5% of the population were aged 80 or over. It is estimated that by 2030, 22.7% of the population will be aged 65 years or older and 6.8% will be 80 or over.31 Comorbidities in patients with AMI are therefore likely to increase, which will mean higher health care costs and increased risk of mortality. It will also mean that certain combinations of comorbidity will have a more direct effect on mortality.2, 3 The care of these patients will pose new challenges and more refined analyses of patterns of comorbidity will be required both for etiologic research and to be able to compare results between hospitals or between different time series in the same department.
CONCLUSIONSDuring the period 2003-2009, the age of patients admitted with AMI and the number of comorbidities increased progressively. However, hospital mortality from AMI decreased year by year, possibly because of more frequent use of percutaneous and surgical revascularization and improved medical treatment.
CONFLICTS OF INTERESTNone.
Received 20 January 2011
Accepted 6 July 2011
Corresponding author: Servicio de Medicina Preventiva, Hospital Universitario Virgen Macarena, Avda. Dr. Fedriani 3, 41071 Sevilla, Spain. mgili@us.es