Keywords
INTRODUCTION
In 2003,1 the American Society of Echocardiography (ASE), in collaboration with other American and European cardiology societies, published new recommendations for estimating the severity of valvular regurgitation with two-dimensional and Doppler echocardiography. The PISA (proximal isovelocity surface area) method has been used, among other useful parameters, for assessing mitral regurgitation (MR) as: a) a specific sign of severity, which would make it possible to distinguish between mild and severe MR when the radius value (R) is <0.4 or >0.9 for an aliasing velocity (Va) of 40 cm/s, and b) a quantitative parameter making it possible to classify the MR as mild when the effective regurgitant orifice area (EROA)2 is <0.20 cm² and severe when >0.40 cm².
These recommendations stress the value of quantitative methods. A recent article3 suggested that EROA is the best predictor of survival out of these methods. However, despite this, in standard practice the calculation of EROA is done less often than it could be due to its technical requirements and being complex and time-consuming. These drawbacks could be avoided by using the faster and shorter methods put forward in the same recommendations, although this is not always possible. The use of a fixed value for the Nyquist limit (NL) can lead to error at extreme levels of MR. The recommendations point out that outcomes can vary widely when calculations are done with different Va, and recommend careful determination of the Va to ensure the proximal flow really has a hemispherical shape. It is difficult to obtain a hemisphere in mild MR with an NL of 40 cm/s; on the other hand, when MR is severe, the image will be elongated and severity would tend to be overestimated. In the former it would be more appropriate to use a higher NL and in the latter, a lower one. Thus, if we want to use a simplified method, it would have to allow for measurements using different NL values.
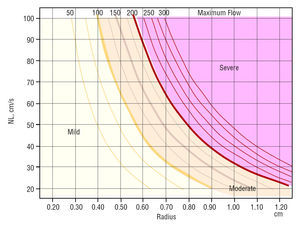
Our group has previously published4 a simplified method based on measuring the PISA R allowing the use of variable Va values. To this end, a nomogram was constructed representing the maximum regurgitant flow (MRF) as curves, with R values and Va values on the x-axis and y-axis, respectively. We then determined the MRF values that best distinguished MR severity into four grades. The selected values, shown graphically as curves, identified 4 areas. Severity was estimated easily by aligning the R value and its corresponding NL on the graph. However, at that time, angiography was used as the reference to obtain these limits, and this criterion may give rise to conflict with the new ASE recommendations.
The purpose of this work was to adapt our simplified method to the most current recommendations of the European and American cardiology societies, and to validate it in a sample population by comparing estimates of MR severity obtained by calculating EROA and by the simplified method proposed.
METHODS
Theoretical Basis
The method proposed is based on the close correlation between MRF and EROA, especially when both are calculated via the PISA method, already cited in previous studies.5-10 It has also been shown that MRF is a good method for estimating MR severity.4,6 Simplified methods have been reported that use regurgitant velocity as a constant at 500 cm/s11 or the value of the velocity-time integral curve corrected by maximum velocity (VTI/maximum velocity) as a constant at 0.35.12 Both simplified estimations would convert the relationship between MRF and EROA or the regurgitant volume into a linear one.
Maximum regurgitant flow depends on 2 factors only, PISA R and Va. The relationship between the 3 parameters can be represented as curves as shown in Figure 1. Each one represents an MRF value, as previously reported.4
In order to adapt our simplified method to the current recommendations, we have drawn the MRF values that differentiate MR severity on the graph in 3- or 4-grade scales in line with the new limits proposed in the recommendations.1
Following ASE recommendations, MR is considered severe when the MRF is >200 mL/s and so we assume that:
- A radius >0.9 for an NL of 40 cm/s is taken as a criterion of severe MR when the specific simplified method is used. This is equivalent to an MRF of 203 mL/s obtained with the formula 2×π×r²×NL.
- The quantitative method considers MR to be severe when EROA >0.4 cm². If we accept a maximum regurgitant velocity (Vmax) of 500 cm/s, the equivalent MRF is 200 ml/s (EROA×Vmax).
Deciding the cut-off for mild MR is more difficult, since the recommendations are less specific and offer several options:
- The specific simplified method proposed by the guidelines considers MR to be mild when R <0.4 cm for an NL of 40 cm/s. This is equivalent to an MRF of 40 mL/s which corresponds to an EROA of 0.08 cm² if calculated for a Vmax of 500 cm/s.
- The quantitative method considers MR to be mild when EROA <0.2 cm². For a constant Vmax of 500 cm/s, MRF is 100 mL/s.
Given the different results, both are shown on the graph, although we prefer to use the value obtained by the quantitative method, due its higher value.
The guidelines only offer criteria for the quantitative method to differentiate mild MR from moderate-severe MR. The cut-off for EROA is 0.3, which, for a Vmax of 500 cm/s, corresponds to an MRF of 150 mL/s.
Figure 1 shows the graph obtained when the previously mentioned separation lines are added.

Figure 1. Nomogram representing the maximum regurgitant flow (MRF) value as curves determined by R and aliasing velocity. The severity limits are marked with the MRF values that correspond to the limits of the effective regurgitant orifice area (EROA) proposed as severity criteria in the consensus guidelines. The area corresponding to moderate severity is divided into 2 grades, II and III, depending on whether a 3- or 4-grade scale is desired. The mild mitral regurgitation (MR) area is also divided into two parts, since the recommendations of the American Society of Echocardiography make it possible to calculate 2 different MRF values depending on how this is done, as explained in the text. NL indicates Nyquist limit.
Practical Use of the Method
Once the PISA image has been isolated and enlarged via a zoom lens, the operator should vary the NL until a clear semicircular image is obtained. The R is measured from this image and drawn on the graph, up to the intersection with the NL value used for the measurement. The MR grade corresponds to the area where the intersection point lies.
Validation
The study included 76 consecutive patients with MR attending our echocardiography laboratory: 39 males, 37 females, range 41 to 83 years (mean age, 65±9 years); 41 were in sinus rhythm and 35 had atrial fibrillation. Mitral regurgitation etiology was rheumatic in 25 cases, ischemic in 22, prolapse in 18 (7 with ruptured chordae tendinae), degenerative causes in 6, and dilated cardiomyopathy in 5. Patients with mitral prostheses were excluded.
Echocardiographic Study
All studies were done using an Ultramark 9 system (ATL, USA) with a 3 MHz phased array probe. Proximal convergence flow was analyzed from the apical plane that provided the best PISA image. The MR convergence flow changes color from blue to yellow and red as flow velocity increases and reaches Va. This happens when the flow nears the MR orifice, giving rise to a more or less hemispherical image. To obtain a better quality image, the frame rate was increased by reducing the color Doppler area to the minimum size necessary. The adjusted frequency of images per second varied from 7 to 15 Hz and the initial Va from 39 to 45 cm/s. If the PISA image was small and flat, Va was reduced until it became hemispherical. If, in contrast, the image was elliptical or was touched by other structures or flows due to its size, Va was increased until the shape of the PISA image was smaller and closer to being a hemisphere. The largest PISA image during mesosystole was selected, focused under zoom, and, when necessary, postprocessed by adjusting the Va accordingly. The PISA R was measured in centimeters from the color inversion to the regurgitant orifice in the mitral valvular plane and in the direction of the ultrasound beam.
To calculate the surface of the flow convergence area it is assumed that the geometric shape is the semicircular projection of a hemisphere. This being the case, flow is calculated as the product of the surface of this hemisphere and the flow velocity at each point on the surface, which is the aliasing velocity. Given that measurements for the greatest PISA value were made in mesosystole, we obtained the MRF
MRF=2×π×r²×Va
The MRF velocity was measured from the apical plane using continuous Doppler ultrasound, aligning the ultrasound beam with the direction of the MR flow. Recordings were improved by adjusting the gain and low velocity filter. The Vmax was measured in centimeters/second and its time integral (VTI) in centimeters. The EROA was calculated using the continuity equation. The regurgitant volume (RV) was calculated as the product of EROA times VTI
EROA=MRF/Vmax
RV=EROA×VTI
Statistical Analysis
Data are presented as mean ± standard deviation (SD). Means were compared using Mann-Whitney test. Linear correlation coefficients were used to analyze the correlation between variables. To establish agreement between discrete variables, a weighted kappa index with biquadratic weights was used.13,14 Normally, agreement is considered excellent when kappa values are between 0.81 and 1, and good if values14 are between 0.61 and 0.8. The statistical package Stata 8.0 was used in the analysis. A P-value <.05 was considered statistically significant.
RESULTS
Baseline Characteristics
Table 1 shows the baseline characteristics and echocardiographic measurements of the 76 patients included.

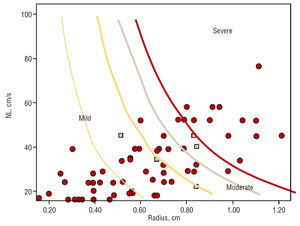
Excellent correlation was found between MRF and EROA (r=0.98; P<.001), as shown in Figure 2.

The patients were divided into 3 groups according to the EROA values obtained: 42 had grade I MR, 16 grade II, and 18 grade III; when a 4-grade scale was used, 42 had grade I, 11 grade II, 5 grade III, and 18 grade IV. When we applied our nomogram with a 3-grade scale, 45 had grade I, 15 grade II, and 16 grade III; when a 4-grade scale was used, 45 had grade I, 10 grade II, 5 grade III, and 16 grade IV. Figure 3 shows the distribution by case on the nomogram.
Table 2 shows the degree of agreement between the 2 methods using a 3-grade scale. The kappa value indicates an excellent agreement of 0.951 (standard error, 0.11). Table 3 shows the same for a 4-grade scale, again with an excellent kappa value of 0.969 (standard error, 0.11).


When the 3-degree scale was used, the nomogram based on the simplified method underestimated severity in 5 cases (6.5%), but never overestimated severity. The 4-degree scale underestimated severity in 7 cases (9.2%).
The points marked in Figure 3 represent each case in the area corresponding to its severity. The squares show the cases where there is disagreement between the MRF and EROA methods. All of these are found at the border areas. Some cases are not shown because they exceeded the values included in the nomogram.

Figure 3. Maximum regurgitant flow in the patients included in the nomogram validation study, and represented on the nomogram. The squares represent the cases where the nomogram underestimated severity compared to EROA quantification. Note that all these border on areas of severity. NL indicates Nyquist limit.
If we compare the 3 cases where the nomogram indicated grade I and the method based on EROA indicated grade II, they had greater MRF values (89±13 vs 36±21; P=.006) and lower maximum velocities (Vmax, 384±61 vs 481±86; P=.029). The 2 cases indicated as grade II by the nomogram and grade III by the EROA method also had greater MRF (186±12 vs 133±26; P=.028), and lower Vmax (373±1.4 vs 476±31; P=.19). Thus, it seems that the cases where the nomogram gives an underestimation are those with high MRF and low Vmax.
DISCUSSION
The use of our nomogram enables the rapid estimation of MR severity with just one measurement, in line with the consensus recommendations of the American and European cardiology societies, and has a high level of agreement with the EROA method, which is far more complex to calculate. Although it has been shown that it can underestimate severity when there are low regurgitation velocities, an important fact in patients with impaired hemody namics, these cases are easily detectable. In these cases, EROA should be calculated and severity classified accordingly.
Quantitative methods are used less often than desirable due to their complexity. Although many systems include suitable calculation methods in their software, thus saving a certain amount of time, not all of them include such features. Due to this, interest has arisen in developing a method based on PISA that enables suitable classification of cases with less effort. Several of these have been published. Some assume a constant maximum velocity11,12 and others use fixed NL values.1,15,16 The proposed method has the advantage of using Vmax set at 500 cm/s for estimating the lower bounds for severity only, and is always supported by the excellent correlation found between MRF and EROA. This offers the advantage of being able to measure R with different Va values, which makes it possible to adjust the PISA profile, avoid interference from other structures or flows and confirm the classification done with measurements made with variable NL, if any doubt remains.
Our nomogram is based on the MRF estimated by PISA which is theoretically sound as a value associated with severity. Our previous study showed good agreement between MRF and MR assessed angiographically, which was then used as a reference and that continues to be a valid reference for estimating MR. Maximum regurgitant flow is based on measuring the same flow as the regurgitant volume and the EROA, such that it would be reasonable to find a close correlation between them as, in fact, happened. However, estimating MR severity via MRF saves us from measuring MR flow velocity and the calculations necessary to obtain the other parameters, saving much time and even added measurement errors. It is only necessary to have the graph near the ultrasound scanner or, ideally, that the system is programmed to indicate MR severity once the PISA R value is introduced, since the system already shows the NL used to obtain the value.
Furthermore, the estimation of MR severity obtained with this method provides good results in terms of interobserver and intraobserver variability (Kp=0.89 and 0.91, respectively.4
Limitations
At present, and in the near future, MR of ischemic origin and those secondary to mitral valve prolapse require better assessment of severity. Although the number of patients is limited in our study, these 2 diseases are sufficiently represented in the sample (53%) to consider that our results can be applied to this population.
The MRF and regurgitant volume depend on the patient's hemodynamic situation to a greater extent than EROA. Flow-dependent methods can over- or underestimate MR severity when MR velocity is very high, as may happen during a hypertensive crisis, or when low, as occurs in patients with low cardiac output. Calculating EROA would be essential in these situations, which are relatively easy to identify clinically. The proposed method led to underestimations in a variable percentage of patients, between 6.5 and 9.2%, depending on whether a 3- or 4-grade scale was used. This underestimation was foreseeable, since the average Vmax in the total sample was low, 464 cm/s. We consider that this does not invalidate the validity of the nomogram, although it implies using it with caution and skill which, on the other hand, is a requirement in all echocardiographic quantification.
CONCLUSIONS
This study describes a nomogram that enables rapid semiquantitative assessment of the severity of mitral regurgitation and which strongly accords with the most recent recommendations of the American and European cardiology societies. Its use makes it possible to extend the undeniable advantages of the PISA method to daily practice.
ACKNOWLEDGMENT
We wish to express our thanks to the members of the biostatistics department, especially Alfonso Muriel and Víctor Abraira, for their excellent work.
Correspondence: Dr. J.L. Moya.
Unidad de Diagnóstico por Imagen Cardiaca. Cardiología de Adultos. Hospital Universitario Ramón y Cajal.
Ctra. de Colmenar, km 9,100. 28034 Madrid. España.
E-mail: jmoya.hrc@salud.madrid.org
Manuscript received April 21, 2006.Accepted for publication July 12, 2006.