To the Editor:
We wish to congratulate Prieto-Solis et al1 for their work on the electrocardiographic diagnosis of left coronary artery occlusion; however, after reading it, we would like to make a few comments.
We believe that the number of patients included with multivessel disease (2 or more vessels) is low, given that ACS is more prevalent than isolated LCA disease. In a recent study it was 5.4%, 24%, and 27% for isolated LCA disease, 3-vessel disease and LCA/3-vessel disease, respectively.2 These data may invalidate the conclusion of the study due to a non-representative sample.
The duration of the ischaemic event may be brief, and in the absence of symptoms, the ECG changes may be minimal,3 which is not mentioned in the article.1
We have also noticed that, in the cases of LCA disease, ST depression is seen in II, III, and aVF of 100%, 60%, and 95% respectively; while in our experience4 it is 65%, 28%, and 35%. We believe that the explanation may be that the LCA cases are not pure, but rather are combined with other lesions, since the percentages change significantly in three vessel disease without LCA involvement (to 92%, 43%, and 76%, respectively.)
Regarding the direction of the vector directed to quadrant-A in the frontal plane (-90º to -180º) or anterior in the horizontal plane, we would like to point out that in our experience (17 patients with LCA subocclusion vs 37 patients with 3-vessel disease without injury to the LCA), the location and direction are very similar in the case of multi-vessel disease, an electrocardiographic finding that does not help differentiate them (Figures 1 and 2)

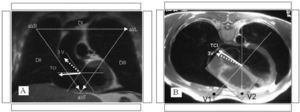
Figure 1. A: frontal plane superimposed on a magnetic resonance image; in the case of 3-vessel disease, the lesion's dipole often falls in the negative hemifield in leads I, II, and III; conversely, in the LCA lesion, it often falls in the positive hemifield in III and in the positive isoelectric hemifield in II and the negative hemifield in I. B: horizontal plane, both in LCA disease as well as three-vessel disease, both fall in the positive hemifield in V1 close to the dividing line, and because of this, isolated analysis of the V1 lead is not useful for differentiating both situations.

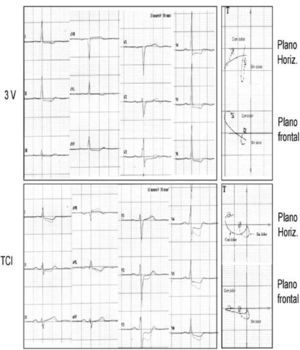
Figure 2. Cardiographic-vector analysis of 2 patients with isolated left coronary artery (LCA) disease and 3-vessel disease (3V) without LCA involvement. The location of the lesion's vector loop is similar in both cases.
The case in Figure 4 from the Prieto-Solis et al1 article (obstruction of the RCA) is an ACS with ST elevation in the lower leads and clear criteria for proximal occlusion of the RCA: ST depression in I and ST elevation in II < III and isoelectric in V1, according to the algorithm we published5,6 and is associated with multivessel disease (ST depression in V2-V6).7
The search for electrocardiographic criteria to differentiate LCA disease from other lesions effectively requires prospective studies, especially in the case of non-ST elevation ACS in which the obstructed artery is the RCA, LCX, or the LAD.
We hope that these comments help to clarify a subject so complex as that discussed in the article on which we are commenting.