Due to the high prevalence of childhood obesity in Spain, we analyzed changes in its prevalence from 2006 to 2007 and from 2011 to 2012, as well as diet, sleep, and sedentary habits in 5- to 14-year-olds and parental misperceptions about their children's excess weight.
MethodsThe sample was from the Spanish National Health Surveys for 2006 to 2007 (n=5590) and for 2011 to 2012 (n=3601). Data were collected by trained personnel through telephone interviews with parents/guardians. Weight and height were self-reported and the International Obesity Task Force cutpoints were used to define overweight and obesity.
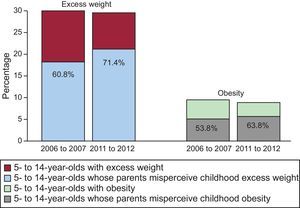
ResultsThe prevalence of childhood excess weight was 30.1% from 2006 to 2007 and 29.7% from 2011 to 2012, while that of childhood obesity was 9.6% and 9%, respectively. Parental misperception of childhood excess weight increased from 60.8% to 71.4% (P<.001). Daily consumption of vegetables increased by 7.8%, while that of soft drinks and snacks decreased. This decrease was greatest in children from families with a low socioeconomic status, who also decreased their consumption of sweets and fast food. Adherence to sleep recommendations decreased by 5%, but adherence to recommended sedentary time did not change.
ConclusionsHigh childhood overweight and obesity rates remained stable in Spain from 2006 to 2007 and from 2011 to 2012, but there was an increase in parental misperception of childhood excess weight. Despite reduced consumption of soft drinks and snacks, there was low adherence to dietary recommendations, hours of sleep, and sedentary habits.
Keywords
Abbreviation
Childhood overweight and obesity increased worldwide at the end of the 20th century,1 with the prevalence of childhood obesity in Spain jumping from 4.9% in 1984 to 13.9% in 2000.2 This trend was paralleled by an increase in the proportion of parents unable to recognize excess weight status in their children,3 reflecting the social normalization of obesity.4
From about 2000, childhood obesity prevalence began to stabilize in many countries.5,6 In Spain, the rate of increase slowed between 2001 and 2006 except among adolescents from a less privileged socioeconomic background.7 These developments were accompanied by increasing parental misperception of childhood weight status.3 Recent data for Spain are inconclusive. Compared with data from 2000,2 the results of a 2011 study indicated an overall stabilization except for a continuing increase in obesity among 6- to 9-year-olds girls.8 In contrast, a 2012 study detected a reduced prevalence among children aged between 8 and 13 years.9 To our knowledge, no study since 2006 has analyzed changes in parental misperception of childhood excess weight.
Factors associated with obesity include consumption of sugar-sweetened soft drinks, a high-energy diet lacking in fruit and vegetables,10,11 insufficient hours of sleep,12 and an excessively sedentary lifestyle.13,14 In Spain, a 1998 survey found that more than 40% of children and adolescents consumed below the recommended amount of fruit and vegetables,15 while other studies found that sugar intake among children accounted for 21% of total caloric intake (double the recommended amount)16 and that the consumption of sugar-sweetened soft drinks increased between 2001 and 2004.17 The proportion of 5- to 15-year-olds who slept less than 8h/d rose from 2.9% in 2001 to 4% in 2003,18 and the proportion watching television for more than 2h/d increased by 4% between 1997 and 2003.19,20
In the present study, we analyzed data from the Spanish National Health Surveys (Encuesta Nacional de Salud de España [ENSE]) for changes in childhood obesity in Spain between 2006 to 200721 and 2011 to 201222 and their relationship with diet, hours of sleep, sedentary activity, and parental misperception of childhood excess weight.
METHODSDataWe analyzed completed ENSE questionnaires from the most recent surveys of children and adolescents, carried out in 2011 to 201223 and 2006 to 2007.24 These surveys have been conducted at varying intervals since 1987 by the Spanish National Institute of Statistics, in partnership with the Ministry of Health, Social Services, and Equality. Noninstitutionalized minors were included in the surveys by stratified multistage sampling. The first-stage sampling units were census tracts, second-stage units were family dwellings, and the third-stage units were individuals. Information was collected between July 2006 and June 2007 and between July 2011 and June 2012. The surveys were conducted by telephone interview; parents or guardians were informed about the survey and the voluntary and anonymous nature of their participation and, after giving verbal consent, answered questions about children and young adolescents in their care. All questions and response options used to measure study variables were identical in the 2 surveys.
The 2011-to-2012 ENSE survey included 5495 0- to 14-year-olds, whereas the 2006-to-2007 survey included 9122 0- to 15-year-olds. The present analysis excluded 0- to 4-year-olds (n=1894 in the 2011-to-2112 survey and n=2869 in the 2006-to-2007 survey) and 15-year-olds (n=663 in the 2006-to-2007 survey). The final sample thus included children and adolescents between the ages of 5 and 14 years: 3601 from the 2011-to-2012 survey and 5590 from the 2006-to-2007 survey. Due to incomplete weight and height data, body mass index was analyzed in subsamples of 2938 individuals from the 2011-to-2012 survey and 4341 from the 2006-to-2007 survey.
VariablesOverweight and ObesityOverweight and obesity status was assigned according to body mass index calculated from self-reported weight and height measurements provided during the interview. Overweight and obesity together constituted excess weight and were defined according to International Obesity Task Force cutpoints.25
Misperception of Excess Weight and ObesityParental misperception of childhood excess weight was evaluated with the following question: “In relation to his/her height, which of the following options best describes your child's weight: 1) substantially above normal, 2) slightly above normal, 3) normal, 4) below normal?” Misperception was defined as answers 3 or 4 in relation to a child with excess weight.
Daily Soft Drink and Food ConsumptionDaily consumption of soft drinks and a range of foods (fruit, vegetables, sweets, fast foods, and snacks) was obtained with the question “How often does your child consume the following foods? 1) Every day, 2) Three or more times a week, 3) Once or twice a week, 4) Less than once a week, 5) Never or almost never.”
Sleep DurationHours of sleep were obtained with the following question: “Can you tell me approximately how many hours your child normally sleeps per day, including naps.” Reported sleep duration was evaluated by comparison with National Sleep Foundation and Centers for Disease Control and Prevention recommendations: a minimum 10h/d for 5- to 9-year-olds and 9h/d for 10- to 14-year-olds.26,27
Sedentary Leisure ActivitySedentary leisure activities include television viewing, playing video games, and computer use in free time. Time dedicated to these activities was obtained from the following questions: “Does your son/daughter watch television every day or almost every day?”, “Approximately how much time per day does your son/daughter spend watching television?”, “Does your son/daughter play video games, play on the computer, or access the internet every day or almost every day?” and “Approximately how much time per day does your son/daughter spend playing video games, playing on the computer, or accessing the internet?” Reported sedentary activity was evaluated in relation to American Academy of Pediatrics recommendations of a maximum 2h/d.28
Sociodemographic variablesCollected sociodemographic variables were sex (boy or girl) and age (5 to 9 years or 10 to 14 years) and family socioeconomic status (high, middle, or low) as defined by the Spanish National Institute of Statistics according to criteria proposed by the Spanish Society of Epidemiology in 1995 and 2012. Family socioeconomic status was assigned according to the occupation and educational level of the main family breadwinner.29 Socioeconomic categories corresponded to Spanish Society of Epidemiology classifications as follows: high status to classes I and II; middle status to classes III, IVa, and IVb; and low status to class V.
AnalysisWe conducted a descriptive analysis of each ENSE survey. Overall frequency distributions were calculated for the following qualitative variables: excess weight, obesity, parental misperception, daily food intake, and adherence to recommendations for hours of sleep and sedentary activity; frequency distributions were further stratified by age, sex, and family socioeconomic status. Overall prevalence was shown when stratified prevalence showed no differences. Quantitative variables (hours of sleep and sedentary activity) were expressed as means and 95% confidence intervals (95%CI). Because sleep recommendations differ for different age groups, sleep duration was stratified by age.
Qualitative variables in the 2 survey periods were compared by chi-square test. Sleep duration was compared by the Student t test, and hours dedicated to sedentary activities were compared by the nonparametric Mann-Whitney U test.
To estimate relative increases or decreases in dependent variables between the 2006-to-2007 and 2011-to-2012 surveys, prevalence ratios were obtained by Poisson regression with robust variance and adjustments for age, sex, and family socioeconomic status. Prevalence ratios for excess weight and obesity are not shown because there were no statistically significant between-survey differences.
The weighting coefficients included in the ENSE surveys were applied in all the analyses conducted. Data were analyzed with SPSS version 13 (SPSS, Inc.; Chicago, Illinois, United States) and STATA version 12.0 (StataCorp.; College Station, Texas, United States).
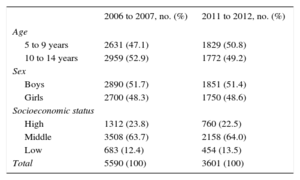
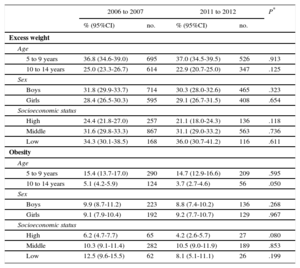
RESULTSSociodemographic characteristics of the samples are shown in Table 1. The prevalence of excess weight was 30.1% in 2006 to 2007 and 29.7% in 2011 to 2012 (P=.696). Obesity prevalence values for the same survey years were 9.6% and 9%, respectively (P=.485). No significant changes were detected in the prevalence of excess weight or obesity adjusted for age, sex, or family socioeconomic status (Table 2). In both survey years, excess weight and obesity were more prevalent among 5- to 9-year olds (P=.001 for both survey years). The relationship between family socioeconomic status and overall excess weight strengthened between the 2006-to-2007 and 2011-to-2012 surveys, but the same trend was not observed for obesity.
Sociodemographic Characteristics
| 2006 to 2007, no. (%) | 2011 to 2012, no. (%) | |
|---|---|---|
| Age | ||
| 5 to 9 years | 2631 (47.1) | 1829 (50.8) |
| 10 to 14 years | 2959 (52.9) | 1772 (49.2) |
| Sex | ||
| Boys | 2890 (51.7) | 1851 (51.4) |
| Girls | 2700 (48.3) | 1750 (48.6) |
| Socioeconomic status | ||
| High | 1312 (23.8) | 760 (22.5) |
| Middle | 3508 (63.7) | 2158 (64.0) |
| Low | 683 (12.4) | 454 (13.5) |
| Total | 5590 (100) | 3601 (100) |
Results were obtained after application of the Spanish National Health Survey weighting coefficients.
Prevalence of Childhood Excess Weight and Obesity Stratified by Age, Sex, and Socioeconomic Status
| 2006 to 2007 | 2011 to 2012 | P* | |||
|---|---|---|---|---|---|
| % (95%CI) | no. | % (95%CI) | no. | ||
| Excess weight | |||||
| Age | |||||
| 5 to 9 years | 36.8 (34.6-39.0) | 695 | 37.0 (34.5-39.5) | 526 | .913 |
| 10 to 14 years | 25.0 (23.3-26.7) | 614 | 22.9 (20.7-25.0) | 347 | .125 |
| Sex | |||||
| Boys | 31.8 (29.9-33.7) | 714 | 30.3 (28.0-32.6) | 465 | .323 |
| Girls | 28.4 (26.5-30.3) | 595 | 29.1 (26.7-31.5) | 408 | .654 |
| Socioeconomic status | |||||
| High | 24.4 (21.8-27.0) | 257 | 21.1 (18.0-24.3) | 136 | .118 |
| Middle | 31.6 (29.8-33.3) | 867 | 31.1 (29.0-33.2) | 563 | .736 |
| Low | 34.3 (30.1-38.5) | 168 | 36.0 (30.7-41.2) | 116 | .611 |
| Obesity | |||||
| Age | |||||
| 5 to 9 years | 15.4 (13.7-17.0) | 290 | 14.7 (12.9-16.6) | 209 | .595 |
| 10 to 14 years | 5.1 (4.2-5.9) | 124 | 3.7 (2.7-4.6) | 56 | .050 |
| Sex | |||||
| Boys | 9.9 (8.7-11.2) | 223 | 8.8 (7.4-10.2) | 136 | .268 |
| Girls | 9.1 (7.9-10.4) | 192 | 9.2 (7.7-10.7) | 129 | .967 |
| Socioeconomic status | |||||
| High | 6.2 (4.7-7.7) | 65 | 4.2 (2.6-5.7) | 27 | .080 |
| Middle | 10.3 (9.1-11.4) | 282 | 10.5 (9.0-11.9) | 189 | .853 |
| Low | 12.5 (9.6-15.5) | 62 | 8.1 (5.1-11.1) | 26 | .199 |
95%CI, 95% confidence interval; ENSE, Encuesta Nacional de Salud de España (Spanish National Health Survey).
Results were obtained after application of the ENSE weighting coefficients.
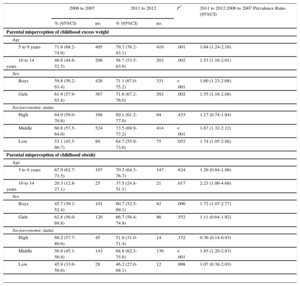
The proportion of parents failing to recognize childhood excess weight increased from 60.8% (95%CI, 58.1%-63.4%) in 2006 to 2007 to 71.4% (95%CI, 68.4%-74.4%) in 2011 to 2012 (P<.001) (Figure 1). This increase was observed in all subgroups except for children from a high or low socioeconomic background (Table 3). Misperception of obesity increased by 10% between 2006 to 2007 and 2011 to 2012 (P=.011). Stratification revealed increases in parental misperception in relation to 10- to 14-year-olds, boys, and a middle socioeconomic status, whereas misperception decreased among parents with high socioeconomic status. Parental misperception of both overall excess weight and obesity was highest in relation to 5 -to 9-year olds.

Prevalence of Parental Misperception of Childhood Excess Weight and Obesity Stratified by Age, Sex, and Family Socioeconomic Status
| 2006 to 2007 | 2011 to 2012 | P* | 2011 to 2012:2006 to 2007 Prevalence Ratio (95%CI) | |||
|---|---|---|---|---|---|---|
| % (95%CI) | no. | % (95%CI) | no. | |||
| Parental misperception of childhood excess weight | ||||||
| Age | ||||||
| 5 to 9 years | 71.6 (68.2-74.9) | 495 | 79.7 (76.2-83.1) | 419 | .001 | 1.64 (1.24-2.16) |
| 10 to 14 years | 48.6 (44.6-52.5) | 298 | 58.7 (53.5-63.9) | 203 | .002 | 1.53 (1.16-2.01) |
| Sex | ||||||
| Boys | 59.8 (56.2-63.4) | 426 | 71.1 (67.0-75.2) | 331 | < .001 | 1.60 (1.23-2.08) |
| Girls | 61.9 (57.9-65.8) | 367 | 71.6 (67.2-76.0) | 292 | .002 | 1.55 (1.16-2.08) |
| Socioeconomic status | ||||||
| High | 64.9 (59.0-70.8) | 166 | 69.1 (61.2-77.0) | 94 | .433 | 1.17 (0.74-1.84) |
| Middle | 60.8 (57.5-64.0) | 524 | 73.5 (69.9-77.2) | 414 | < .001 | 1.67 (1.32-2.12) |
| Low | 53.1 (45.5-60.7) | 89 | 64.7 (55.9-73.6) | 75 | .052 | 1.74 (1.05-2.88) |
| Parental misperception of childhood obesity | ||||||
| Age | ||||||
| 5 to 9 years | 67.9 (62.7-73.5) | 197 | 70.3 (64.3-76.7) | 147 | .624 | 1.26 (0.84-1.88) |
| 10 to 14 years | 20.3 (12.8-27.1) | 25 | 37.5 (24.8-51.1) | 21 | .017 | 2.23 (1.06-4.68) |
| Sex | ||||||
| Boys | 45.7 (39.2-52.4) | 101 | 60.7 (52.5-69.1) | 82 | .006 | 1.72 (1.07-2.77) |
| Girls | 62.8 (56.0-69.8) | 120 | 66.7 (58.4-74.9) | 86 | .552 | 1.11 (0.64-1.92) |
| Socioeconomic status | ||||||
| High | 69.2 (57.7-80.6) | 45 | 51.9 (31.0-71.4) | 14 | .152 | 0.36 (0.14-0.93) |
| Middle | 50.9 (45.1-56.8) | 143 | 68.8 (62.3-75.6) | 130 | < .001 | 1.85 (1.20-2.83) |
| Low | 45.9 (33.0-58.6) | 28 | 46.2 (27.0-68.1) | 12 | .998 | 1.07 (0.38-2.03) |
95%CI, 95% confidence interval; ENSE, Encuesta Nacional de Salud de España (Spanish National Health Survey).
Results were obtained after application of the ENSE weighting coefficients. Prevalence ratios are adjusted for age, sex, and family socioeconomic status.
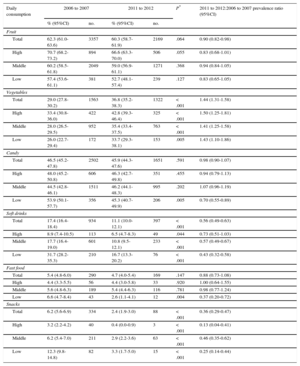
Daily consumption of fruit, vegetables, sweets, soft drinks, fast food, and snacks in 2006 to 2007 and 2011 to 2012 is shown in Table 4. These figures show an overall increase of 7.8% in vegetable consumption and decreases of 6.4% and 3.7% in the consumption of soft drinks and snacks, respectively. Stratification by socioeconomic status revealed that vegetable consumption increased most in children from a high socioeconomic status background and that consumption of soft drinks decreased most among children from families with a low socioeconomic status; children in this group also decreased their consumption of fast food and sweets. In 2011 to 2012, sweets consumption did not differ between socioeconomic groups.
Prevalence of the Daily Consumption of Fruit, Vegetables, Sweets, Soft Drinks, Fast Food, and Snacks in the Total Study Population and After Adjustment for Socioeconomic Status
| Daily consumption | 2006 to 2007 | 2011 to 2012 | P* | 2011 to 2012:2006 to 2007 prevalence ratio (95%CI) | ||
|---|---|---|---|---|---|---|
| % (95%CI) | no. | % (95%CI) | no. | |||
| Fruit | ||||||
| Total | 62.3 (61.0-63.6) | 3357 | 60.3 (58.7-61.9) | 2169 | .064 | 0.90 (0.82-0.98) |
| High | 70.7 (68.2-73.2) | 894 | 66.6 (63.3-70.0) | 506 | .055 | 0.83 (0.68-1.01) |
| Middle | 60.2 (58.5-61.8) | 2049 | 59.0 (56.9-61.1) | 1271 | .368 | 0.94 (0.84-1.05) |
| Low | 57.4 (53.6-61.1) | 381 | 52.7 (48.1-57.4) | 239 | .127 | 0.83 (0.65-1.05) |
| Vegetables | ||||||
| Total | 29.0 (27.8-30.2) | 1563 | 36.8 (35.2-38.3) | 1322 | < .001 | 1.44 (1.31-1.58) |
| High | 33.4 (30.8-36.0) | 422 | 42.8 (39.3-46.4) | 325 | < .001 | 1.50 (1.25-1.81) |
| Middle | 28.0 (26.5-29.5) | 952 | 35.4 (33.4-37.5) | 763 | < .001 | 1.41 (1.25-1.58) |
| Low | 26.0 (22.7-29.4) | 172 | 33.7 (29.3-38.1) | 153 | .005 | 1.43 (1.10-1.86) |
| Candy | ||||||
| Total | 46.5 (45.2-47.8) | 2502 | 45.9 (44.3-47.6) | 1651 | .591 | 0.98 (0.90-1.07) |
| High | 48.0 (45.2-50.8) | 606 | 46.3 (42.7-49.8) | 351 | .455 | 0.94 (0.79-1.13) |
| Middle | 44.5 (42.8-46.1) | 1511 | 46.2 (44.1-48.3) | 995 | .202 | 1.07 (0.96-1.19) |
| Low | 53.9 (50.1-57.7) | 356 | 45.3 (40.7-49.9) | 206 | .005 | 0.70 (0.55-0.89) |
| Soft drinks | ||||||
| Total | 17.4 (16.4-18.4) | 934 | 11.1 (10.0-12.1) | 397 | < .001 | 0.56 (0.49-0.63) |
| High | 8.9 (7.4-10.5) | 113 | 6.5 (4.7-8.3) | 49 | .044 | 0.73 (0.51-1.03) |
| Middle | 17.7 (16.4-19.0) | 601 | 10.8 (9.5-12.1) | 233 | < .001 | 0.57 (0.49-0.67) |
| Low | 31.7 (28.2-35.3) | 210 | 16.7 (13.3-20.2) | 76 | < .001 | 0.43 (0.32-0.58) |
| Fast food | ||||||
| Total | 5.4 (4.8-6.0) | 290 | 4.7 (4.0-5.4) | 169 | .147 | 0.88 (0.73-1.08) |
| High | 4.4 (3.3-5.5) | 56 | 4.4 (3.0-5.8) | 33 | .920 | 1.00 (0.64-1.55) |
| Middle | 5.6 (4.8-6.3) | 189 | 5.4 (4.4-6.3) | 116 | .781 | 0.98 (0.77-1.24) |
| Low | 6.6 (4.7-8.4) | 43 | 2.6 (1.1-4.1) | 12 | .004 | 0.37 (0.20-0.72) |
| Snacks | ||||||
| Total | 6.2 (5.6-6.9) | 334 | 2.4 (1.9-3.0) | 88 | < .001 | 0.36 (0.29-0.47) |
| High | 3.2 (2.2-4.2) | 40 | 0.4 (0.0-0.9) | 3 | < .001 | 0.13 (0.04-0.41) |
| Middle | 6.2 (5.4-7.0) | 211 | 2.9 (2.2-3.6) | 63 | < .001 | 0.46 (0.35-0.62) |
| Low | 12.3 (9.8-14.8) | 82 | 3.3 (1.7-5.0) | 15 | < .001 | 0.25 (0.14-0.44) |
95%CI, 95% confidence interval; ENSE, Encuesta Nacional de Salud de España (Spanish National Health Survey).
Results were obtained after application of the ENSE weighting coefficients. Prevalence ratios are adjusted for age, sex, and family socioeconomic status.
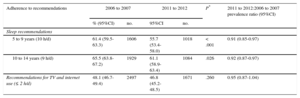
In 2006 to 2007, 5- to 9-year-olds slept 9.67h/d (95%CI, 9.63-9.71) and in 2011 to 2012 children in the same age group slept 9.52h/d (95%CI, 9.47-9.57), a decrease of 9 min/d (P<.001). Children aged 10 to 14 years slept 8.94h/d in 2006 to 2007 (95%CI, 8.89-8.98) and 8.84h/d in 2011 to 2012 (95%CI, 8.78-8.88), a 6-minute decrease (P=.003). Adherence to sleep recommendations thus decreased by 5.9% among 5- to 9-year-olds and by 4.5% among 10- to 14-year-olds (Table 5). After adjustment for sex and family socioeconomic status, the sleep duration values for 2011 to 2012 represent a reduction of approximately 10% from those for 2006 to 2007.
Prevalence of Adherence to Recommendations for Childhood Sleep Duration and Sedentary Activities
| Adherence to recommendations | 2006 to 2007 | 2011 to 2012 | P* | 2011 to 2012:2006 to 2007 prevalence ratio (95%CI) | ||
|---|---|---|---|---|---|---|
| % (95%CI) | no. | 95%CI | no. | |||
| Sleep recommendations | ||||||
| 5 to 9 years (10 h/d) | 61.4 (59.5-63.3) | 1606 | 55.7 (53.4-58.0) | 1018 | < .001 | 0.91 (0.85-0.97) |
| 10 to 14 years (9 h/d) | 65.5 (63.8-67.2) | 1929 | 61.1 (58.9-63.4) | 1084 | .026 | 0.92 (0.87-0.97) |
| Recommendations for TV and internet use (≤ 2 h/d) | 48.1 (46.7-49.4) | 2497 | 46.8 (45.2-48.5) | 1671 | .260 | 0.95 (0.87-1.04) |
95%CI, 95% confidence interval; ENSE, Encuesta Nacional de Salud de España (Spanish National Health Survey); TV, Television.
Results were obtained after application of the ENSE weighting coefficients. Prevalence ratios are adjusted for age, sex, and family socioeconomic status.
In 2006 to 2007, Spanish 5- to 14-year-olds dedicated an average 2.4h/d (95%CI, 2.47-2.57) to sedentary activities. In 2011 to 2012, the figure was 2.5h/d (95%CI, 2.38-2.48), representing an increase of 5 min/d (P=.004). Adherence to recommendations for maximum sedentary time did not vary, remaining close to 50% (Table 5). In both survey years, a positive association was observed between adherence to recommendations and higher family socioeconomic status (data not shown in the tables).
DISCUSSIONThe prevalence of excess weight and obesity among Spanish 5- to 14-year-olds was similar in 2006 to 2007 and 2011 to 2012, both overall and after adjustment for age, sex, and family socioeconomic status. However, the intersurvey period showed a marked increase in the proportion of parents unable to recognize excess weight in their children. There was an overall increase in the consumption of vegetables and a decrease in the consumption of soft drinks and snacks. Children from a low socioeconomic background consumed fewer sweets and less fast food. There was an overall reduction in sleep duration and an increase in the time dedicated to sedentary activities.
These data reveal a stabilization of the prevalence of childhood excess weight and obesity in Spain. The reported prevalence values are similar to those among children aged between 8 and 9 years in the 1998-to-2000 enKid study2 and the 2011 ALADINO study.8 The results presented here are the first to show a stabilization of excess weight prevalence among 10- to 14-year-olds. Despite this stabilization, Spanish rates of childhood excess weight and obesity are among the highest in the world.30 The results of the present analysis coincide with those of other studies showing an accentuation of the relationship between childhood excess weight and family socioeconomic status in 2011 to 201231 and a higher prevalence of excess weight and obesity in 5- to 9-year-olds.32
Up until 2006, parental misperception of childhood excess weight in Spain tracked the increases in childhood obesity.3 Our study shows that parental misperception in Spain has continued to grow despite the stabilization of childhood weight, and is now one of the highest in the world.4 Although parental misperception of excess weight may be skewed by erroneous estimates of children's weight, there was a similar increase in parental misperception of obesity, which has a lower risk of weight misclassification. Possible causes of parental misperception include comparison with other children who are more obese,33 fear of social stigmatization, and avoidance of guilt feelings.3 Other possible influences are the general increase in adult obesity and the associated social normalization of elevated body weight. As in other studies, misperception was highest among parents of younger children, for whom excess weight is widely accepted as a transitory characteristic that will disappear with growth.33 The increasing misperception of childhood weight is worrying because parents who do not detect weight problems in their children are unlikely to take steps to modify obesogenic habits.34,35 The exception to this trend was the decreased misperception of childhood obesity among parents with a high socioeconomic status, possibly reflecting a higher capacity to resist social pressures among people with greater wealth or a higher educational level.
There was an overall positive trend to 2011 to 2012 in the consumption of vegetables, soft drinks, and snacks; however, consumption of sweets, fast foods, and fruit did not change. Vegetable consumption increased most in children from a high socioeconomic background, whereas the largest reductions in soft drink, sweets, and fast food consumption were observed in children from a low socioeconomic background. In 2011 to 2012, sweets consumption did not differ according to family socioeconomic status. Consumption of fruit, vegetables, and soft drinks continues to show a relationship with socioeconomic status.36 Vegetable consumption remains below WHO recommendations,37 and the reduced soft drink consumption, while marked, is insufficient.38 Consumption of unhealthy foods remained highest among children from a low socioeconomic background. Fruit consumption, among the highest in Europe,39 did not change.
In 2011 to 2012, 5- to 9-year-olds slept 9 min/d less than the same age group in 2006 to 2007, whereas 10- to 14-year-olds slept 6 min/d less. These decreases translate into a drop in adherence to sleep recommendations of around 50%, in line with international studies.40 Adherence to recommendations for maximum sedentary time did not change, remaining slightly below 50%. These findings are concerning because habits established in childhood and adolescence set the pattern for adulthood. There is, moreover, an established inverse relationship among children between sleep duration and the time devoted to sedentary activities.41 Sedentary behavior among children is widespread throughout the world,42 and is a major health determinant, independently of the level of physical activity.13
The stabilization of childhood weight and the positive trend in the consumption of some foods come in the wake of the 2005 launch of the Spanish strategy on nutrition, physical activity, and obesity prevention (NAOS),43 and to some degree may reflect success of this strategy. However, a number of factors bring the effectiveness of the NAOS strategy into question; these include the discontinuation of some program activities,44,45 nonadherence to self-regulation agreements by the food and drink vending machine sector,46 the doubtful effectiveness of the PAOS self-regulation code governing food advertising directed at children,47 and the negative trends reported here in parental misperception, sleep duration, and sedentary activity. A possible alternative explanation for the observed changes is the effects of the economic crisis in Spain since 2008. Between 2006 and 2012, the price of food and nonalcoholic drinks increased by 12%,48 and 41% of Spaniards claimed to have adjusted their dietary habits in order to save money.49 These adjustments may have reduced the consumption of superfluous foods such as soft drinks and snacks and their replacement with other, healthier foods such as vegetables. This hypothesis is supported by the larger reduction in the consumption of these unhealthy foods among children from a low socioeconomic background. An earlier study attributed the major drop in body weight among Cubans during the 1991 to 1995 economic crisis to food shortages and an increase in manual labor.50
LimitationsSelf-reported survey data generally produce underestimates of body mass index because respondents tend to overestimate height and underestimate weight.51 However, studies in representative Spanish populations indicate that self-reported weight status is a valid parameter for classifying people as nonobese or obese.52,53 Our goal was not to produce precise estimates of obesity, but rather to analyze its temporal development from survey data obtained with the same methodology. Assuming that body mass index would be underestimated to the same degree in both survey years, the temporal analysis should be valid.
Sleep duration was not analyzed independently for weekdays and weekends because the questionnaires do not make this distinction.
There is a well-known association between childhood obesity and physical inactivity; however, this parameter was not considered in the analysis due to the lack of quantitative data in the ENSE surveys related to the time dedicated to physical activity and its intensity.
CONCLUSIONSDespite the stabilization of childhood obesity in Spain between 2006 to 2007 and 2011 to 2012, its prevalence remains excessively high, especially among children from a less privileged background. During the intersurvey period, parental misperception of childhood excess weight grew alarmingly. The ENSE surveys reveal that Spanish children do not adhere to national and international recommendations on diet, sleep duration, or sedentary behavior.
Policy directed at improving childhood and adolescent health should include obesity awareness programs. These programs should be targeted at parents, who play a fundamental role in establishing healthy habits, and at families with a low socioeconomic status, among whom there is greater potential for improving health through changes to dietary, sleep, and sedentary habits.54,55
FUNDINGThis project was financed by the Carlos III Institute of Health through the Fondo de Investigación en Salud (Project ENPY 1015/13).
CONFLICTS OF INTERESTNone declared.
- –
The most recently published studies indicate stabilization of childhood overweight and obesity prevalence in Spain between 2000 and 2010 at around 30% (International Obesity Task Force cutpoints). Up until 2006, parental misperception of childhood weight tracked the increasing prevalence of childhood obesity. The increasing prevalence of childhood obesity in Spain during this period was accompanied by worsening dietary, sleep, and sedentary habits.
- –
Childhood obesity prevalence in Spain has stabilized (9.6% in 2006 to 2007 and 9% in 2011 to 2012). Over the same period, the frequency of parental misperception of childhood excess weight increased by 11%, breaking with the previous tendency to track the prevalence of childhood obesity.
- –
Spanish children slept between 6min/d and 9min/d less in 2011 to 2012 than in 2006 to 2007 and spent 5min/d more in front of an electronic device screen.
- –
Childhood consumption of soft drinks, sweets, and snacks decreased in the intersurvey period, with a more pronounced decline among children from a low socioeconomic background. Vegetable consumption increased.